

- Sudden spikes in null or empty values after a pipeline change
- Drops in the number of unique IDs, indicating upstream duplication issues
- Unusual shifts in a numeric metric such as fare amount, order value, lead time, etc.
- Outliers in mean, max, or standard deviation that may indicate data corruption
Metrics tracked automatically
By default, each selected field generates a time-series for every metric available for its data type. Metrics can be narrowed per column; for monitors defined as code, see monitors as code.
Metrics available per data type:
Redshift does not compute
NUM_UNIQUE or PCT_UNIQUE on numeric columns, so they are skipped there. A column whose whole selection is skipped produces no predictions.
Setting up a field stats monitor
-
Navigate to the table where you want to create the monitor and click
Add Monitor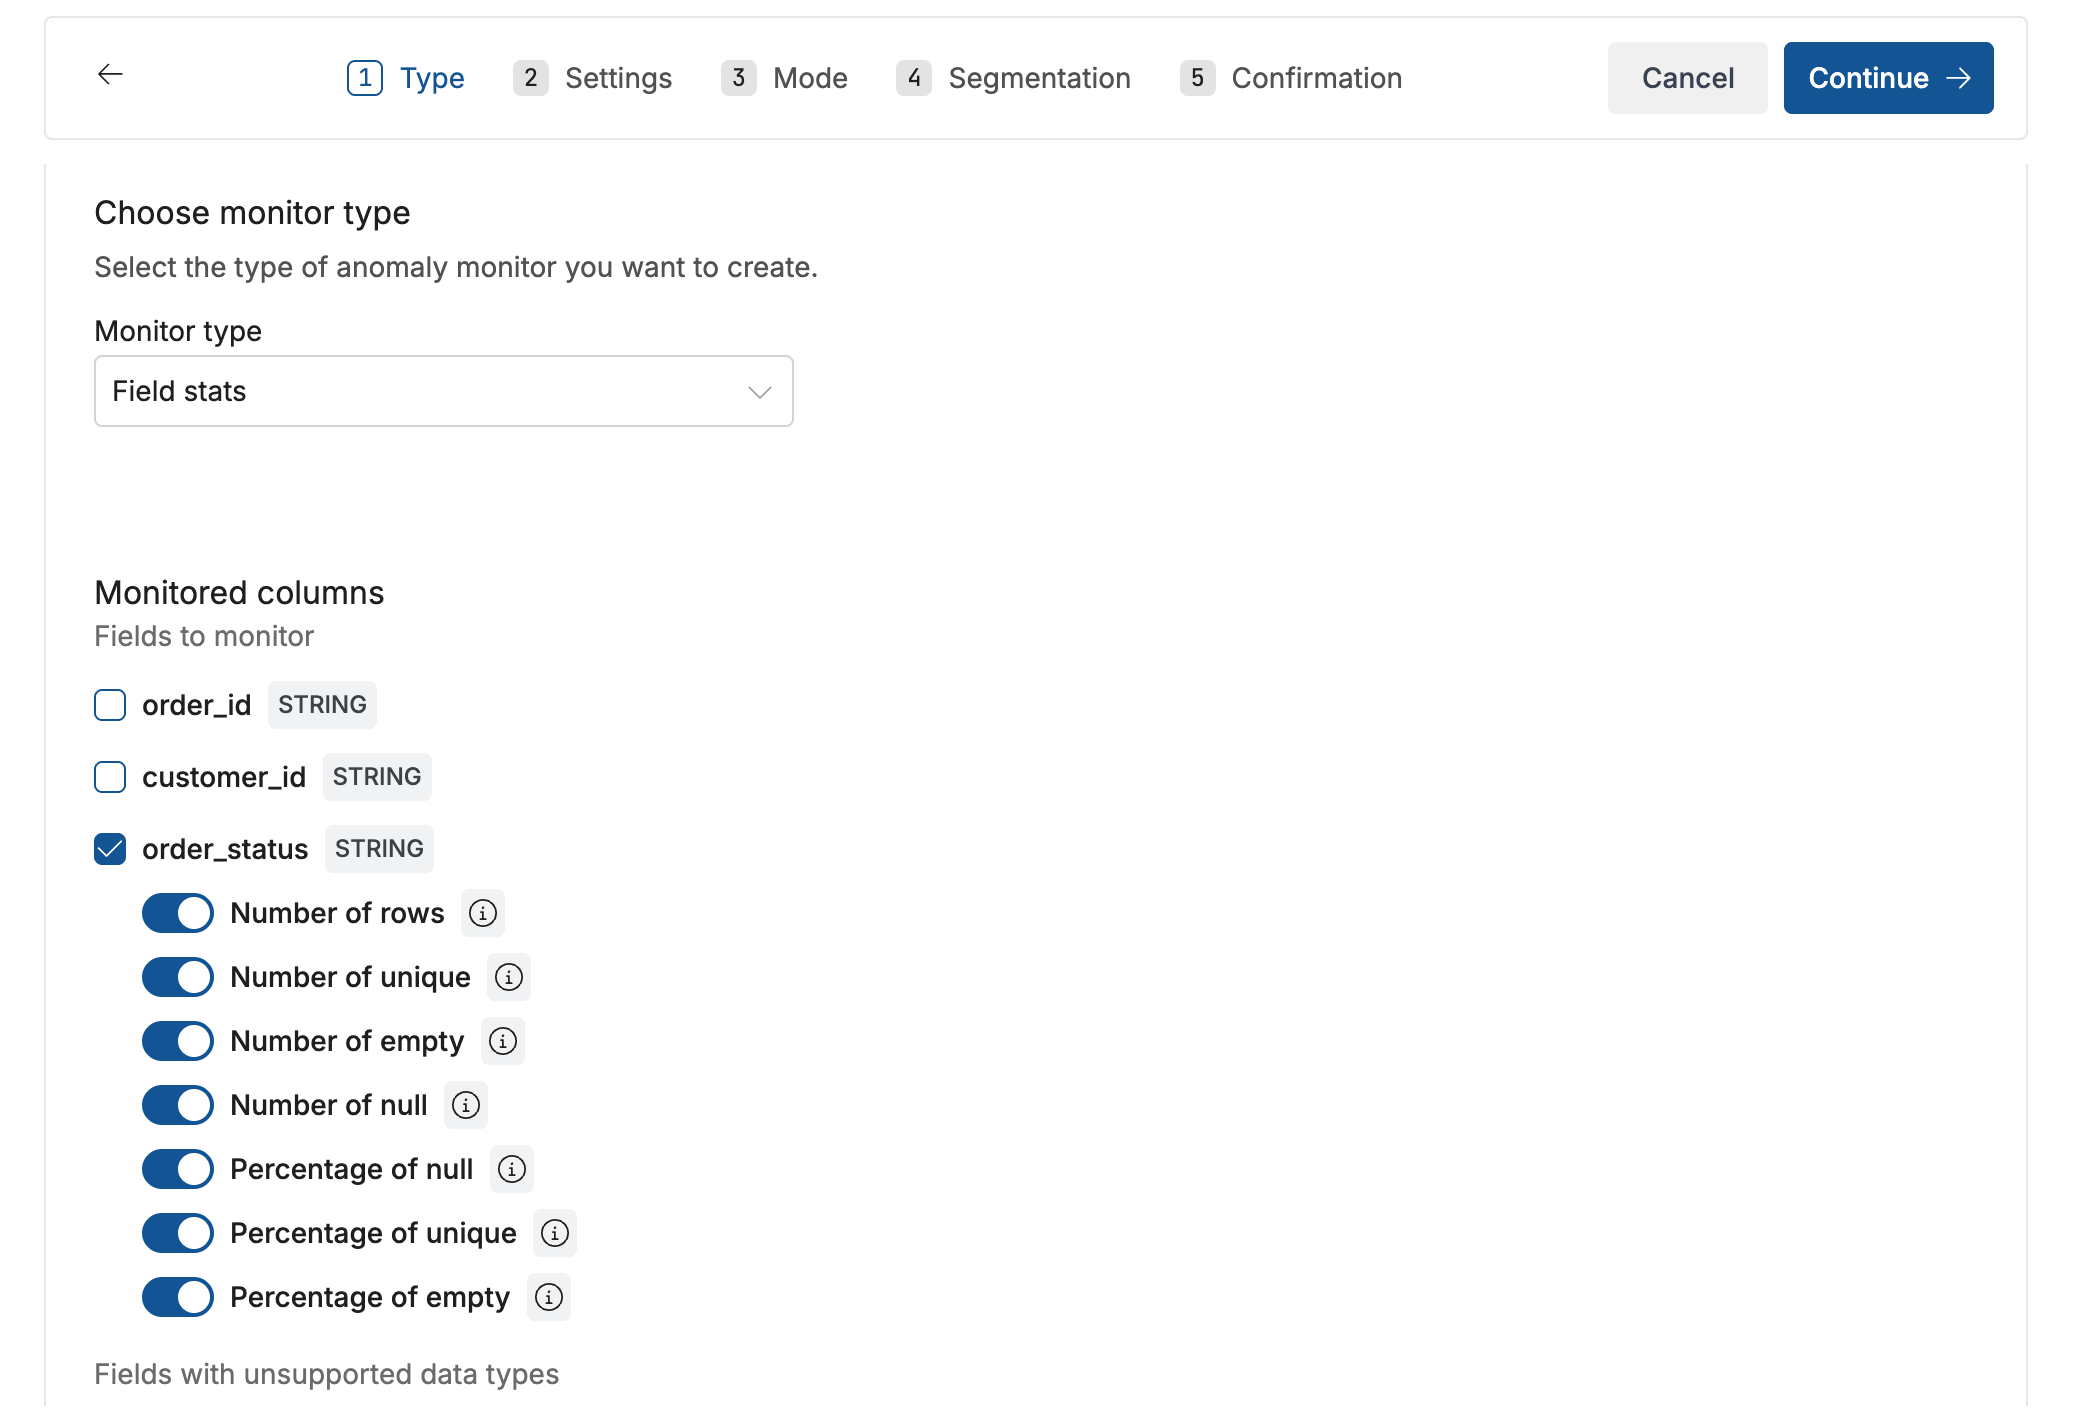
-
Select
Field statsand choose the fields you want to monitor
You can monitor one or multiple fields at once. For each selected field, choose the metrics to track; all are on by default. -
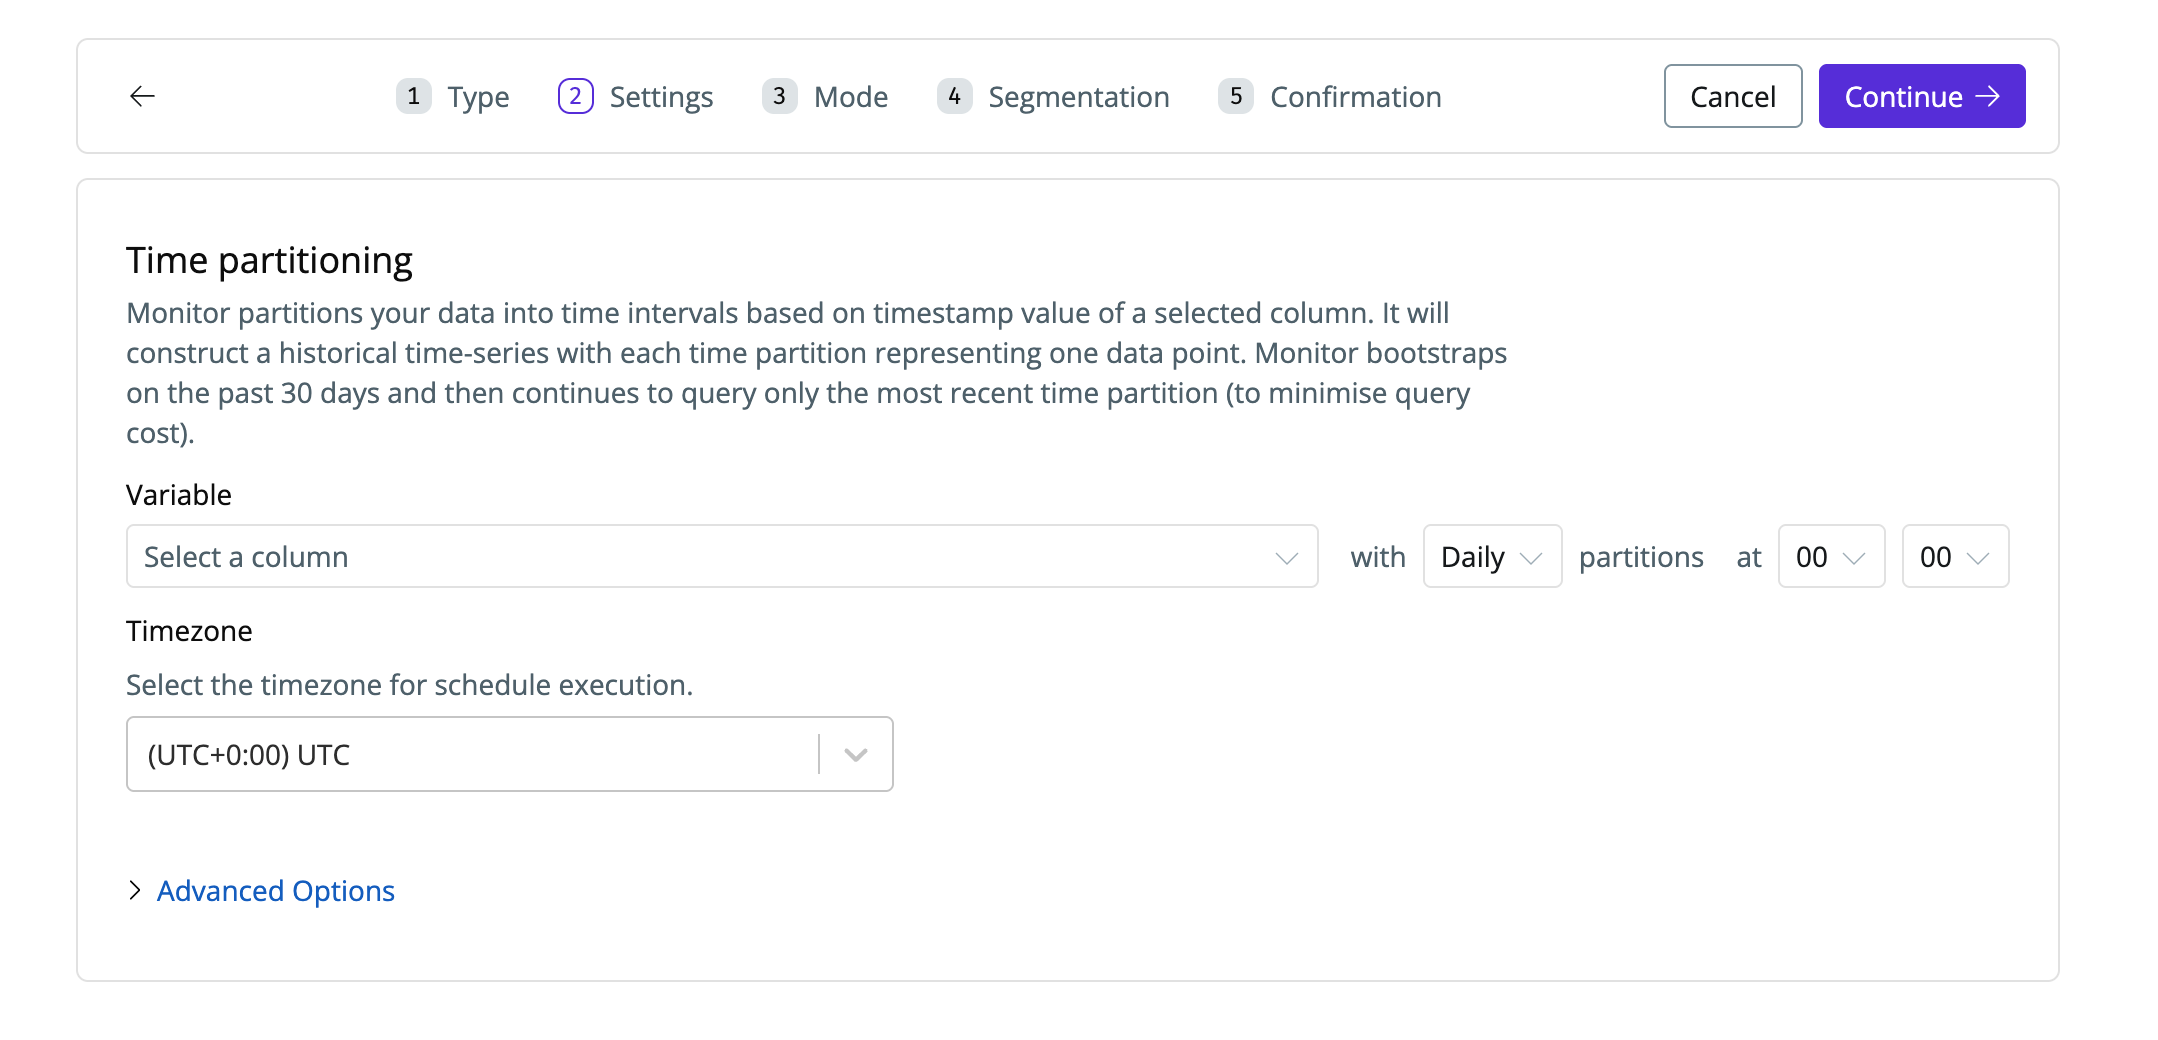
Configure time partitioning. A time-series will be learned per metric per field, using the timestamp column you select.
-
Set sensitivity, and severity (optional)
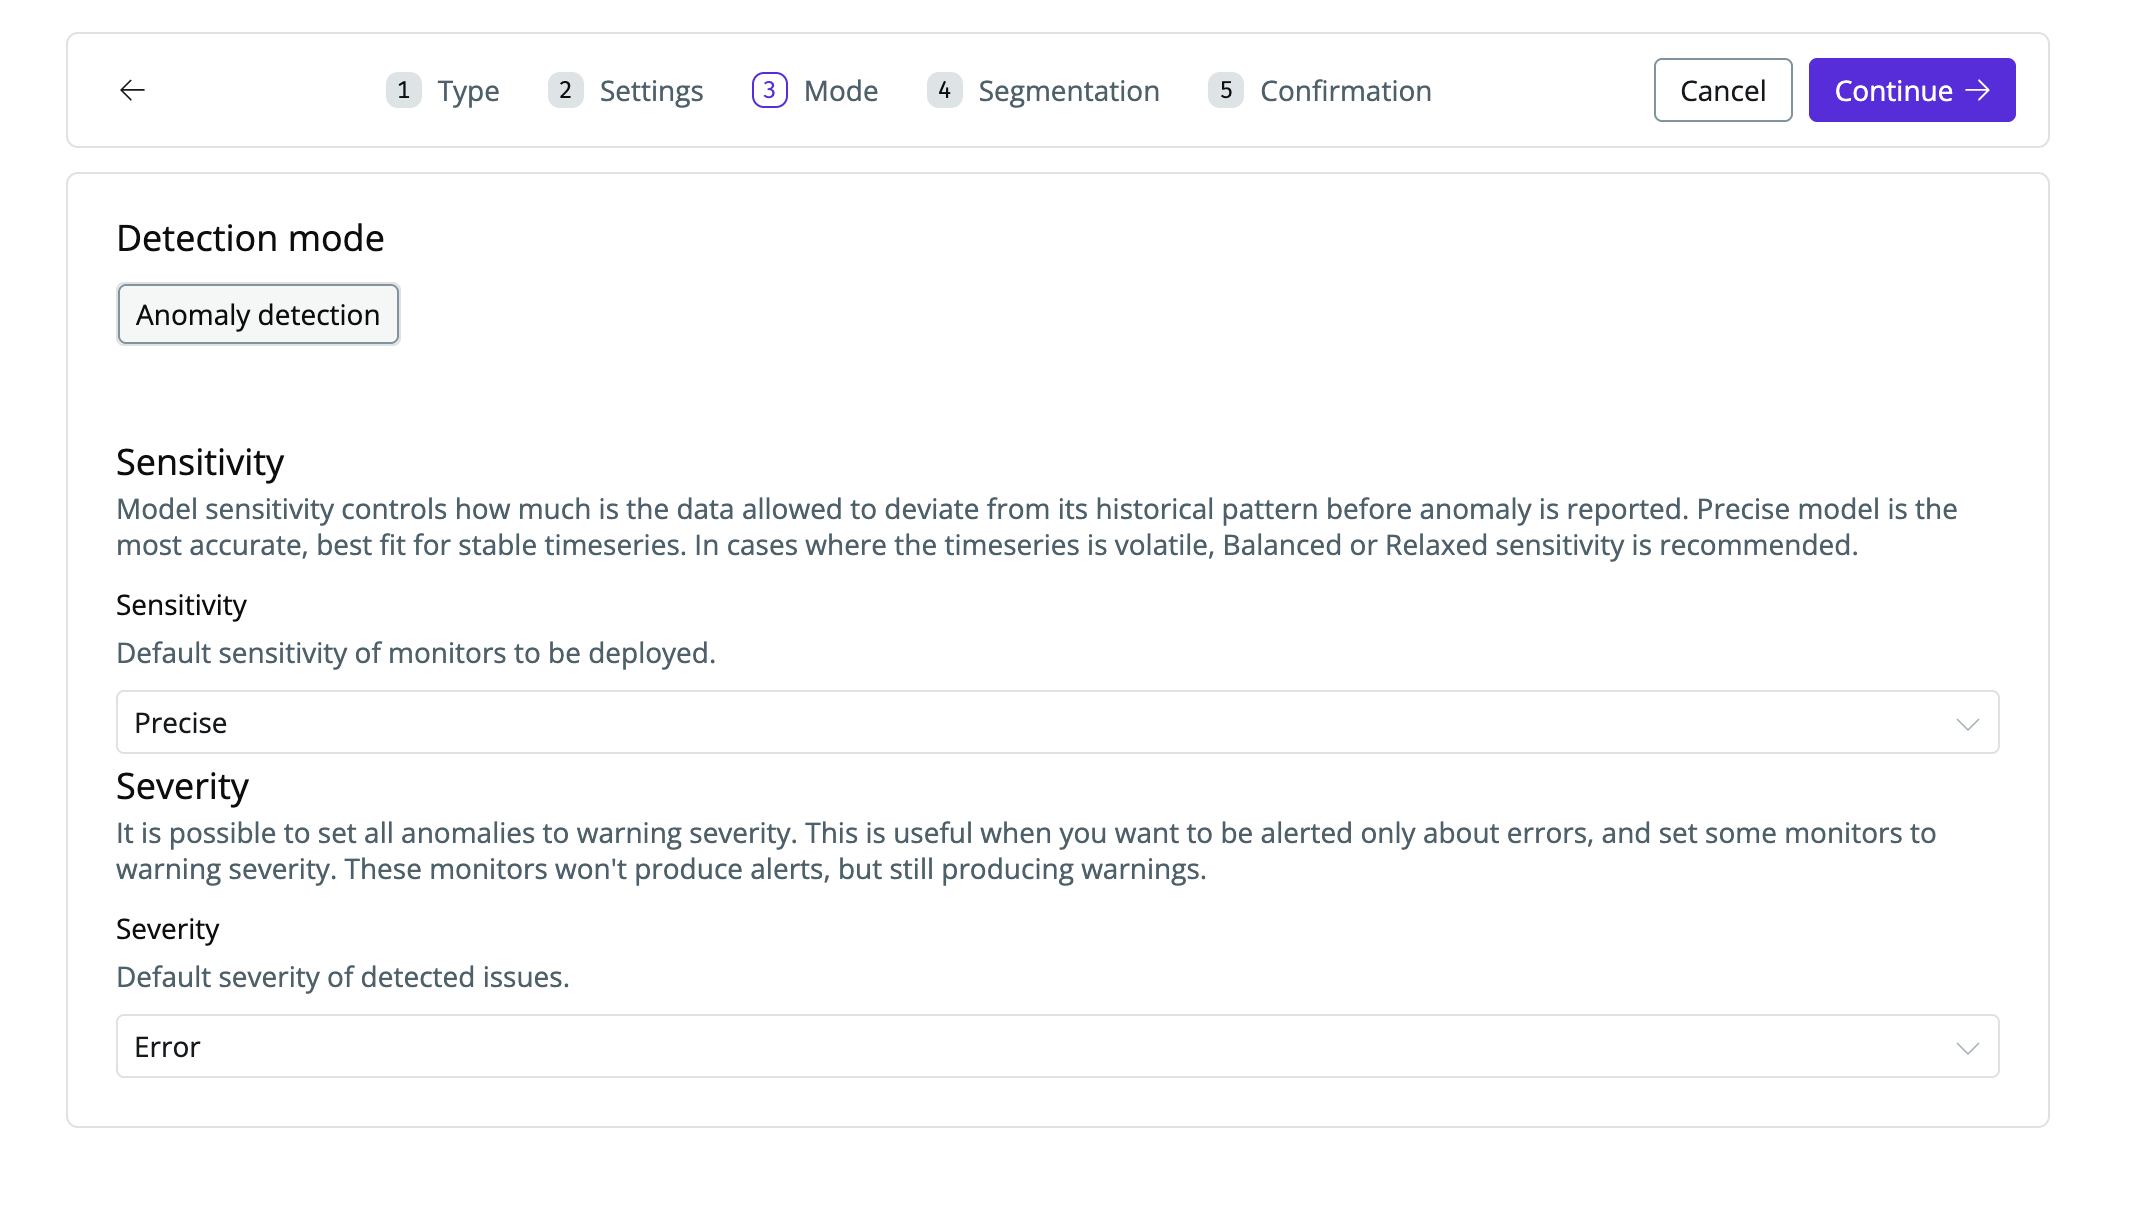
Field stats monitors bootstrap the past 30 days of history, then only query new partitions going forward to reduce cost. Anomaly detection begins immediately after setup.
Resetting a monitor
If you modify historical data and want to re-learn the 30-day baseline, open the monitor, go toSettings, and click Reset monitor.
This action is not reversible — only reset if you are certain the historical values have changed.