

Core concepts
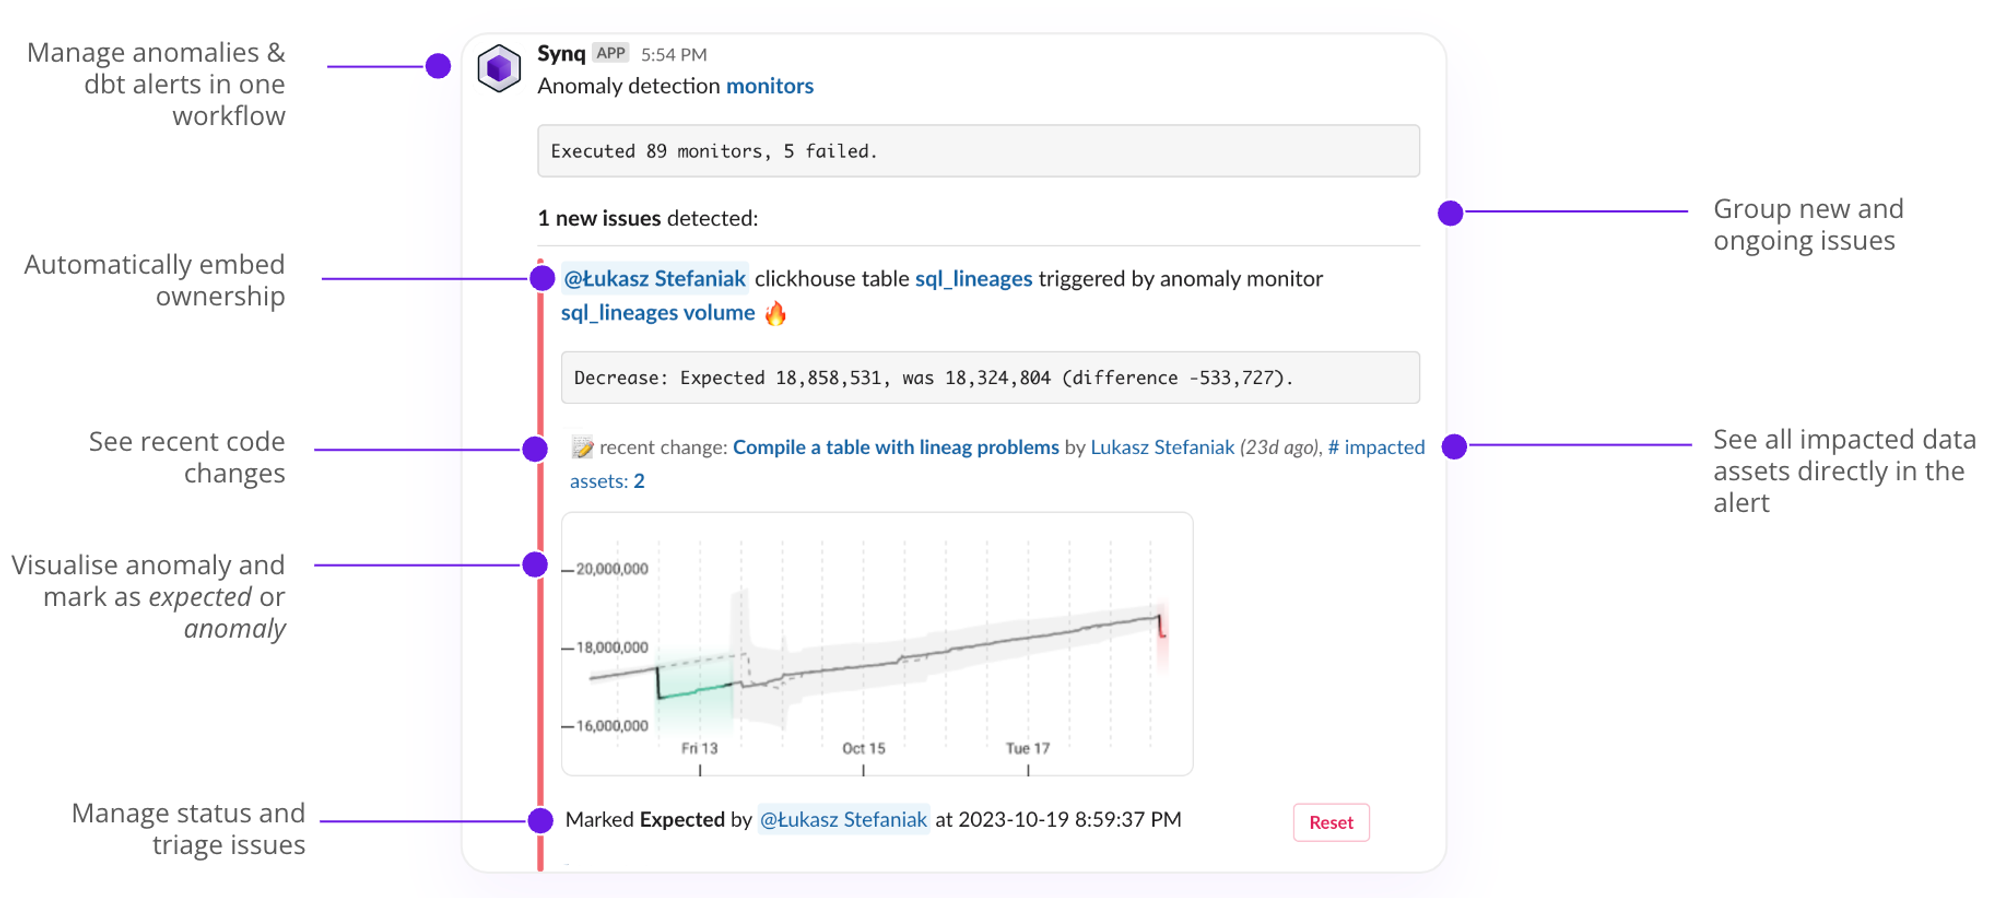
- New and ongoing issues. By default you are alerted only about new issues. You can also get reminders about issues that are still open. See Configuring an alert.
- Ownership. If the asset has an owner, the alert shows it. If the owner has a Slack handle, the person or group is tagged in the alert.
- Recent code changes. The alert shows the most recent code change on the asset and who made it, so you can check if it caused the error. Click it to open the change in GitHub or GitLab.
- Downstream assets. The alert shows how many downstream tables and BI assets depend on the asset, to help you judge the impact. Click it to open a filtered lineage view.
- Error message. The alert shows the error message from the source system, cleaned up where possible. For dbt and Coalesce Transform tests, it shows what is wrong and how many rows failed.
- Anomaly chart. For an anomaly, the alert shows the chart with past annotations.
- Status. You can change the issue status from the alert, so others can see who is working on it.
A Slack message shows at most 15 issues per section. If there are more, the message ends the section with “… and X more”.
Setting up an alert
Routing alerts
- See Routing alerts