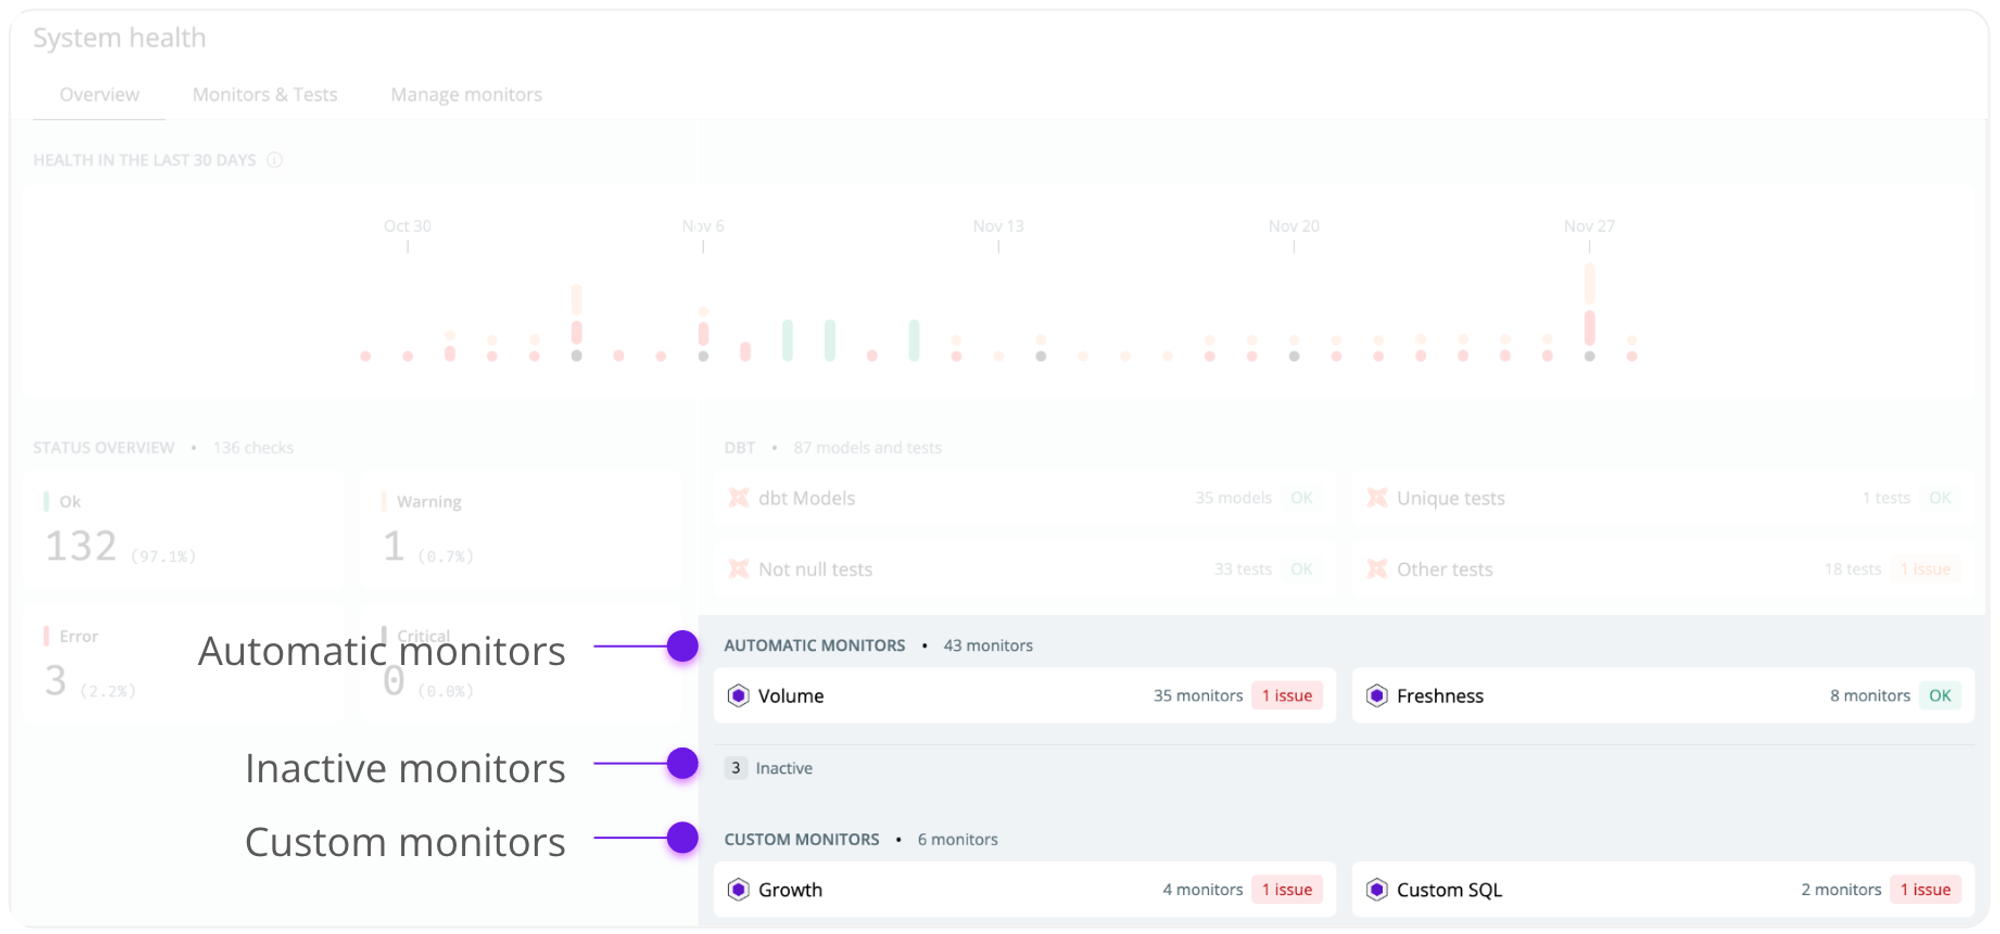
- Automatic monitors—queries your metadata and can be set up with little configuration.
- Custom monitors—queries your raw data and requires a more custom implementation to support advanced use cases.
External tests (e.g. from dbt, SQLMesh, or Coalesce Transform) don’t count toward your monitor limit. Integrate them to get a complete 360° view of your data health.
Automatic monitors
Automatic monitor queries your metadata such as the Snowflake Information Schema. This means they’re easy to configure as you don’t have to define a custom time dimension. As automatic monitors only query metadata, they incur minimal additional processing costs.Table Stats
The table stats monitor is an all-in-one monitor for row count, freshness, and delay. It’s out recommended automatic monitor.
Freshness
The freshness monitor looks at a table’s timestamp and alerts you if it’s been too long since the last update.
Volume
The volume monitor looks at the number of rows in a table to detect how much data is added or removed and alerts you of abnormal increases or decreases.
Schema
The schema monitor detects changes in your environment and alerts you of added, removed, or updated fields.
Custom monitors
Custom monitors can help detect issues more nuanced to your business, such as a custom monitor detecting a change in business metrics or a drop in one segment. Custom monitors query your raw data and should be used selectively to avoid incurring unnecessary costs. Custom monitors have to be configured individually by, e.g., specifying a time dimension, a field to group the monitor by, and custom SQL for an aggregate metric (e.g.,avg(revenue))
Custom volume
The custom volume monitor detects issues in the volume of data in a time series and is highly configurable.
Custom SQL
The custom monitor detects issues in a time series, as represented by your specific SQL statement.
Field stats
The field stats monitor detects issues in the health of a specific field (e.g., %, not null or % empty values).
How monitors work
Most monitors are based on a time series model to predict the expected value of, e.g., the number of rows or a business metric you specified as an SQL statement. If a new data point falls significantly outside our prediction confidence interval, we alert you of an anomaly. Our model uses seasonal decomposition to build the most robust anomaly detection.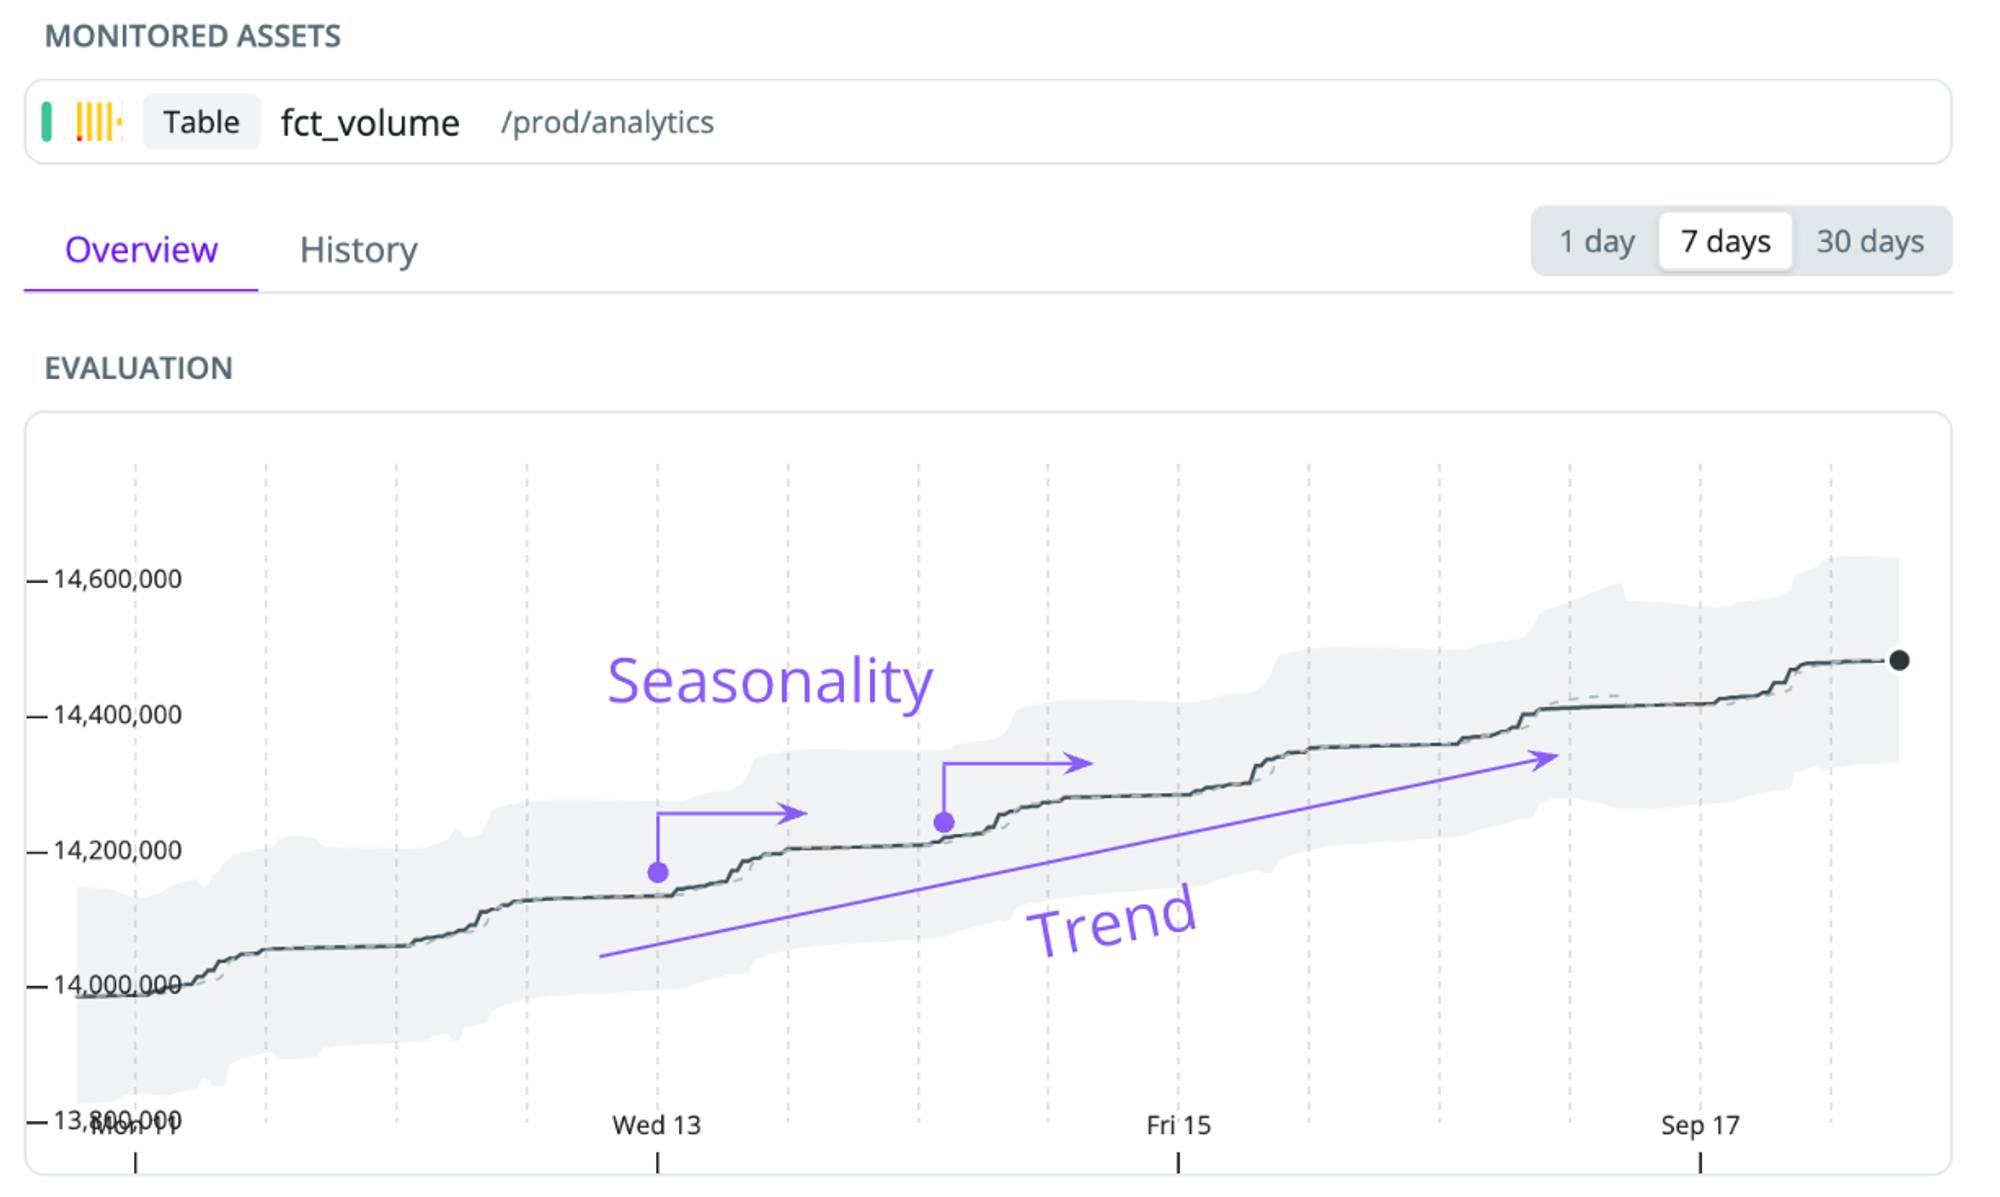
- Seasonality—our models account for intraday seasonality. This helps us learn if patterns, such as a spike by the start of the business day, are expected behavior.
- Trend—many datasets have a trend - e.g., a transactions table that’s always increasing as the business acquires more users. We detrend the data to ensure we only alert you of abnormal behaviors.
- Sensitivity—the algorithm looks at the past few days to understand the volatility of the data. If data changes a lot, it accepts a broader range of values. If the values are stable, they tighten the range and become more sensitive.
- Trigger thresholds—we detect patterns of anomalies. In case of a sharp change, we alert immediately. If we detect smaller anomalies, we wait for confirmation by the next observation to avoid triggering temporary small deviations.
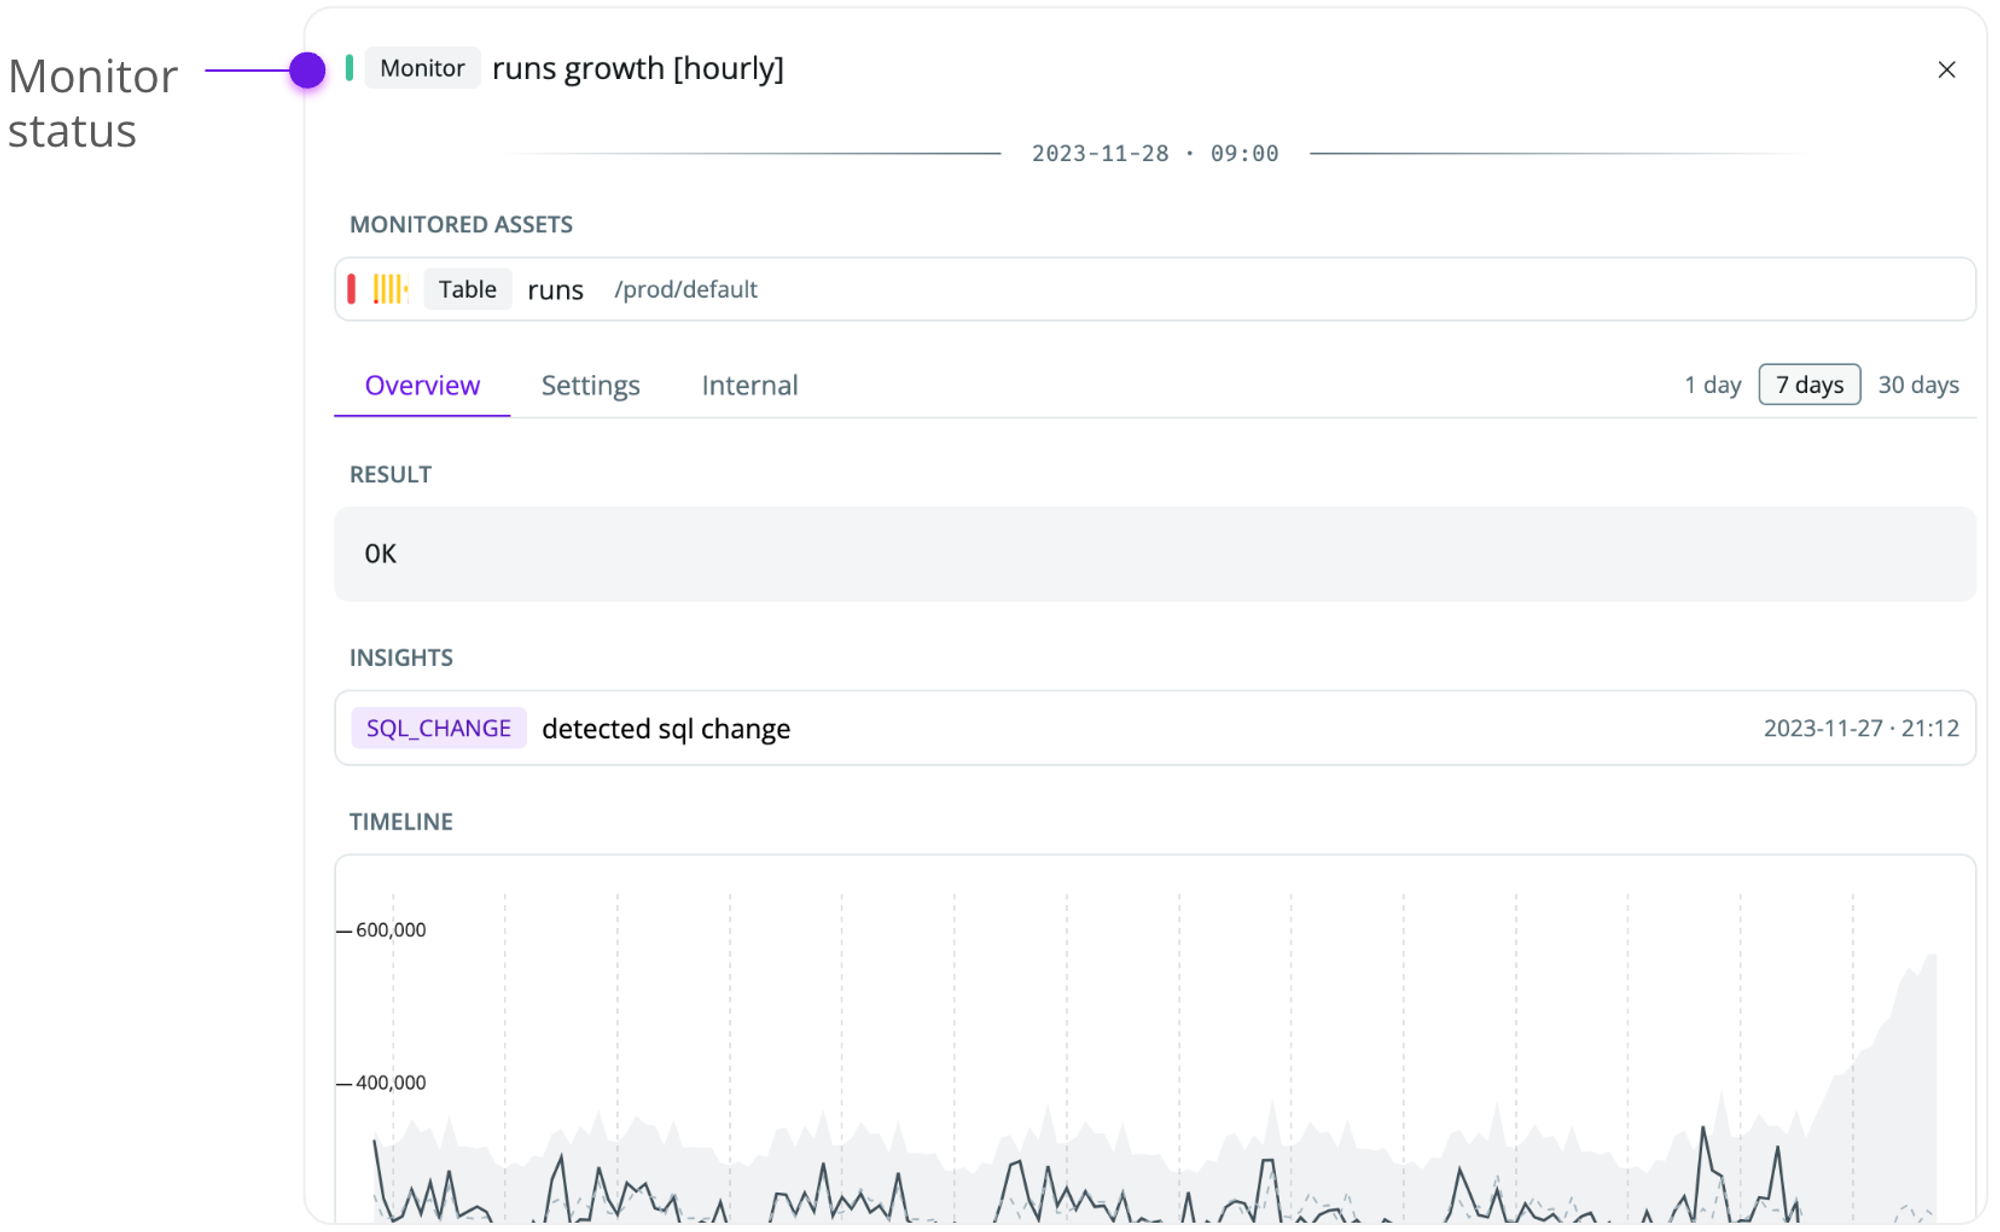
Monitor severity
Each monitor has a severity that helps you understand the current state.- OK—the monitor is active, and no issues have been detected
- Error—the monitor is active, and an unresolved issue has been detected
- Fatal—the monitor is not functioning as expected (e.g., due to insufficient permissions to the data warehouse).
- Inactive—the monitor hasn’t yet finished learning the historical patterns of your data, or there’s not sufficient data for us to train the monitor