Getting started
- Install the CLI
- Set up an API Client by clicking
Add clientwith the following scopes
Edit SQL TestsEdit Automatic MonitorsEdit Custom Monitors
- Run
synq-monitorsusing the credentials from above
Defining monitors in code
Create a YAML file where you’ll be managing the monitor setup, for example,synq_monitors.yml. You can split your configuration up into multiple files and use namespaces to manage individual domains or data products independently.
Example content of the file
Configuring a monitor
You can define all custom monitor types as code (freshness, volume, custom_numeric, and field_stats). Read more about each monitor type.
Obtaining IDs from the UI
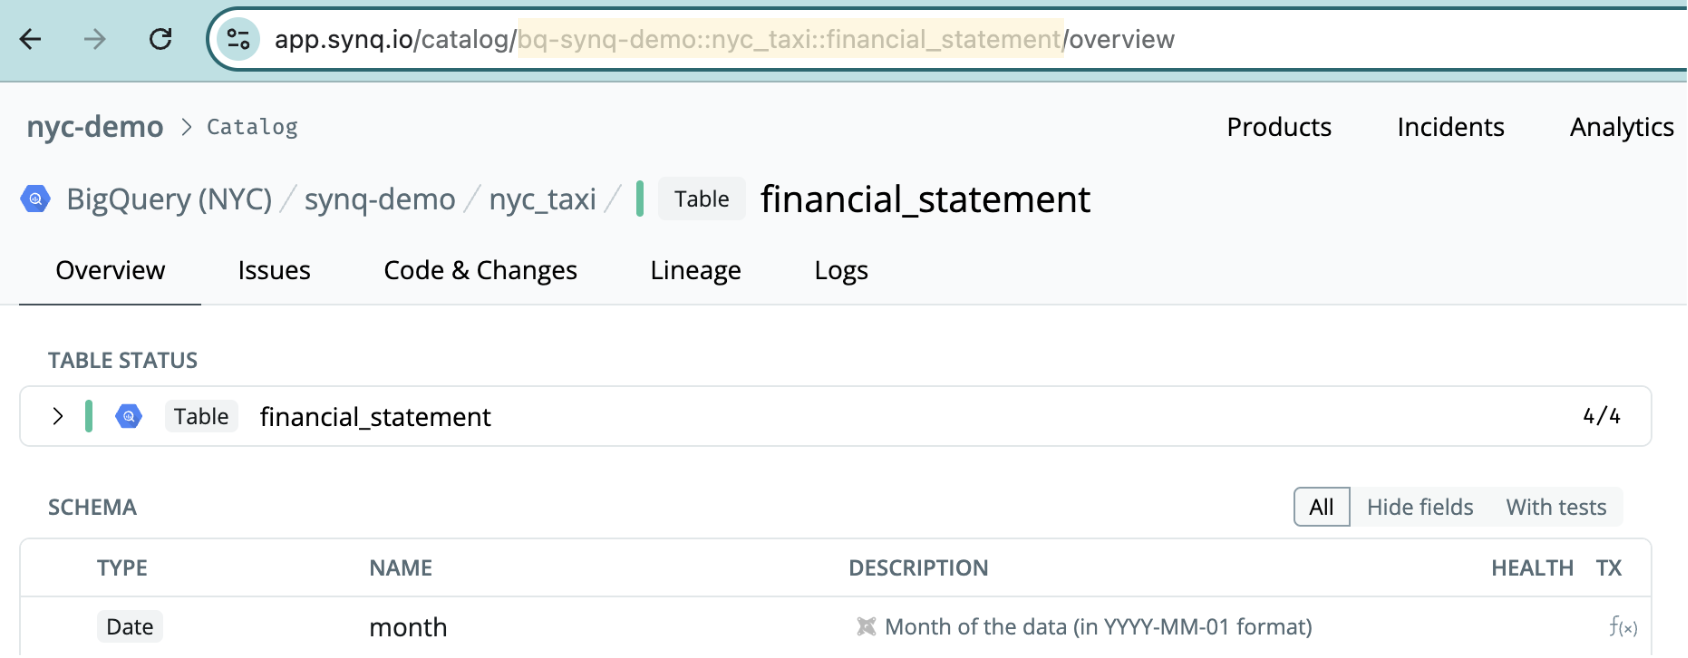
When configuring a monitor,monitored_id is the full table identifier as represented in the platform. You can locate this ID by navigating to a table in the UI (using the catalog or search functionality) and copying the ID from the URL.
In the example below, bq-synq-demo::nyc_taxi::financial_statement will be the ID.
Understanding the configurable parameters
You can see all the configurable parameters in the Available YAML Fields in the readme. For more examples of configuring individual monitors, see our Examples repo.Verifying monitors in the UI
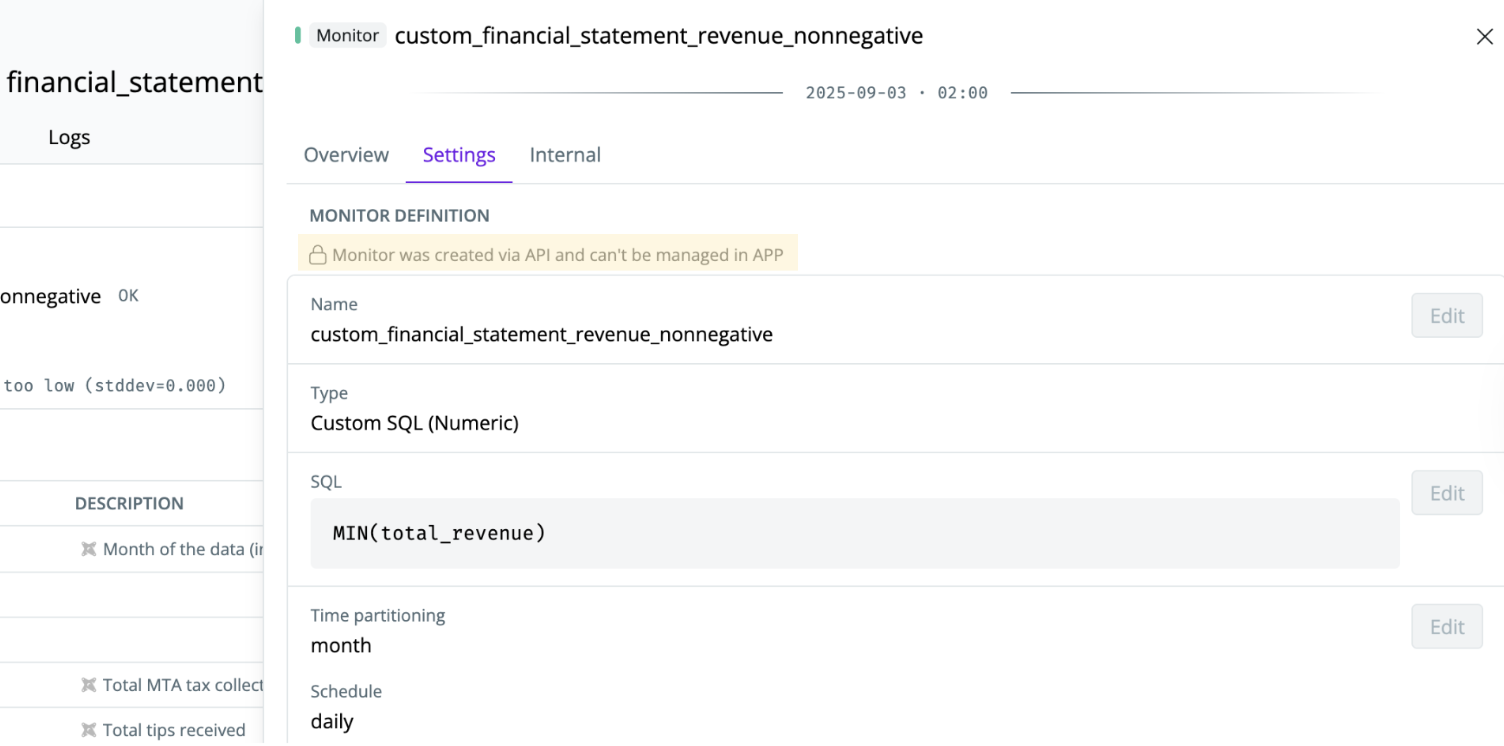
If you navigate to theSettings menu for a monitor, you can verify that it’s created by code by seeing the Monitor was created via API and can't be managed in APP label.