The default freshness and volume monitors have been merged into the Table stats monitor. You can see more on the Table stats monitor page.
Setting up a freshness monitor
- Navigate to
Health→Manage monitors - Click
Create monitor groupto define the tables you want to monitor - Use the browser to narrow down the tables you want to monitor
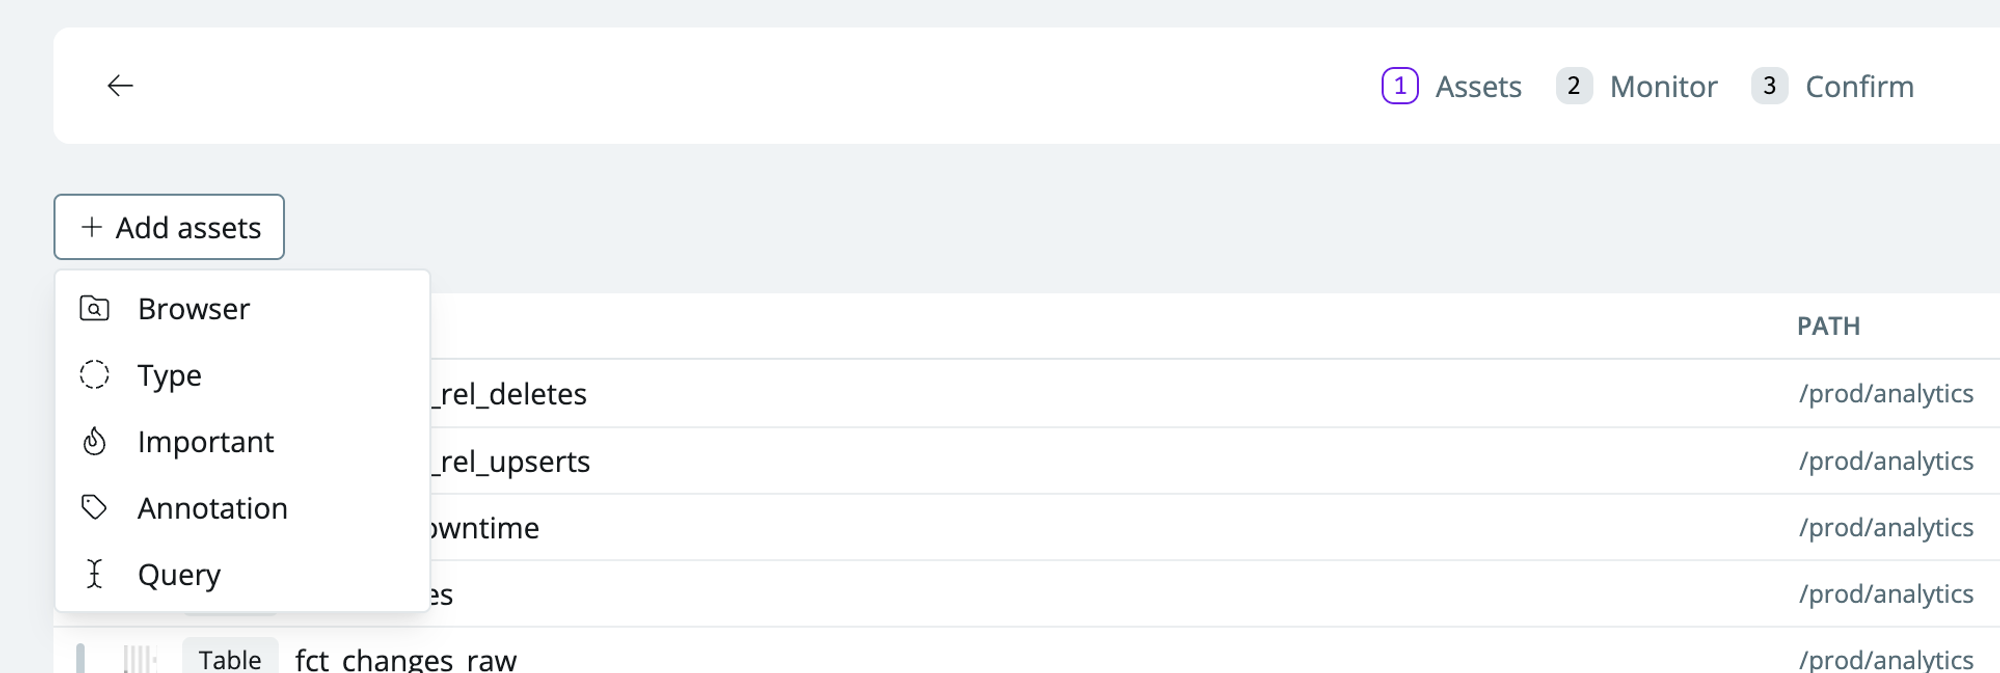
- Browser—select specific schemas or search for tables to monitor (your data warehouse tables and transformation models from dbt, SQLMesh, and Coalesce Transform are automatically mapped)
- Annotation—select assets with metadata definitions such as tags defined in your transformation layer (dbt, SQLMesh, or Coalesce Transform)
- Important—select assets that you’ve marked as important
- Query—advanced selection. E.g., search for specific keyword matches
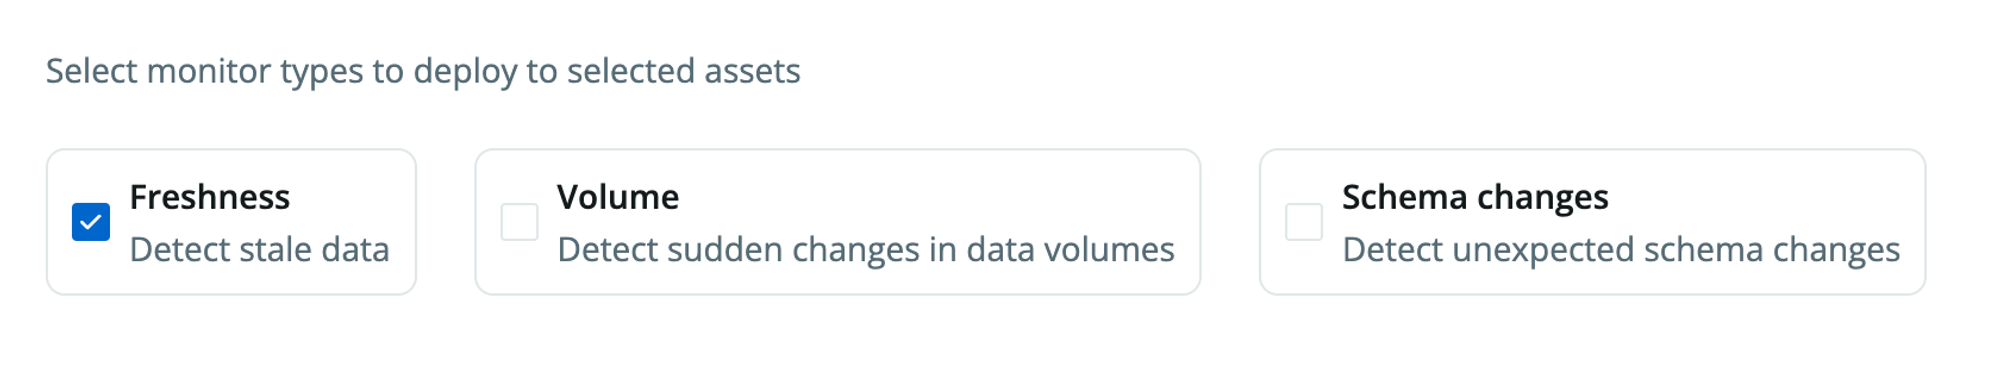
- Check
Freshnessto set up a freshness monitor group
- Name the monitor (e.g., freshness on all sources).
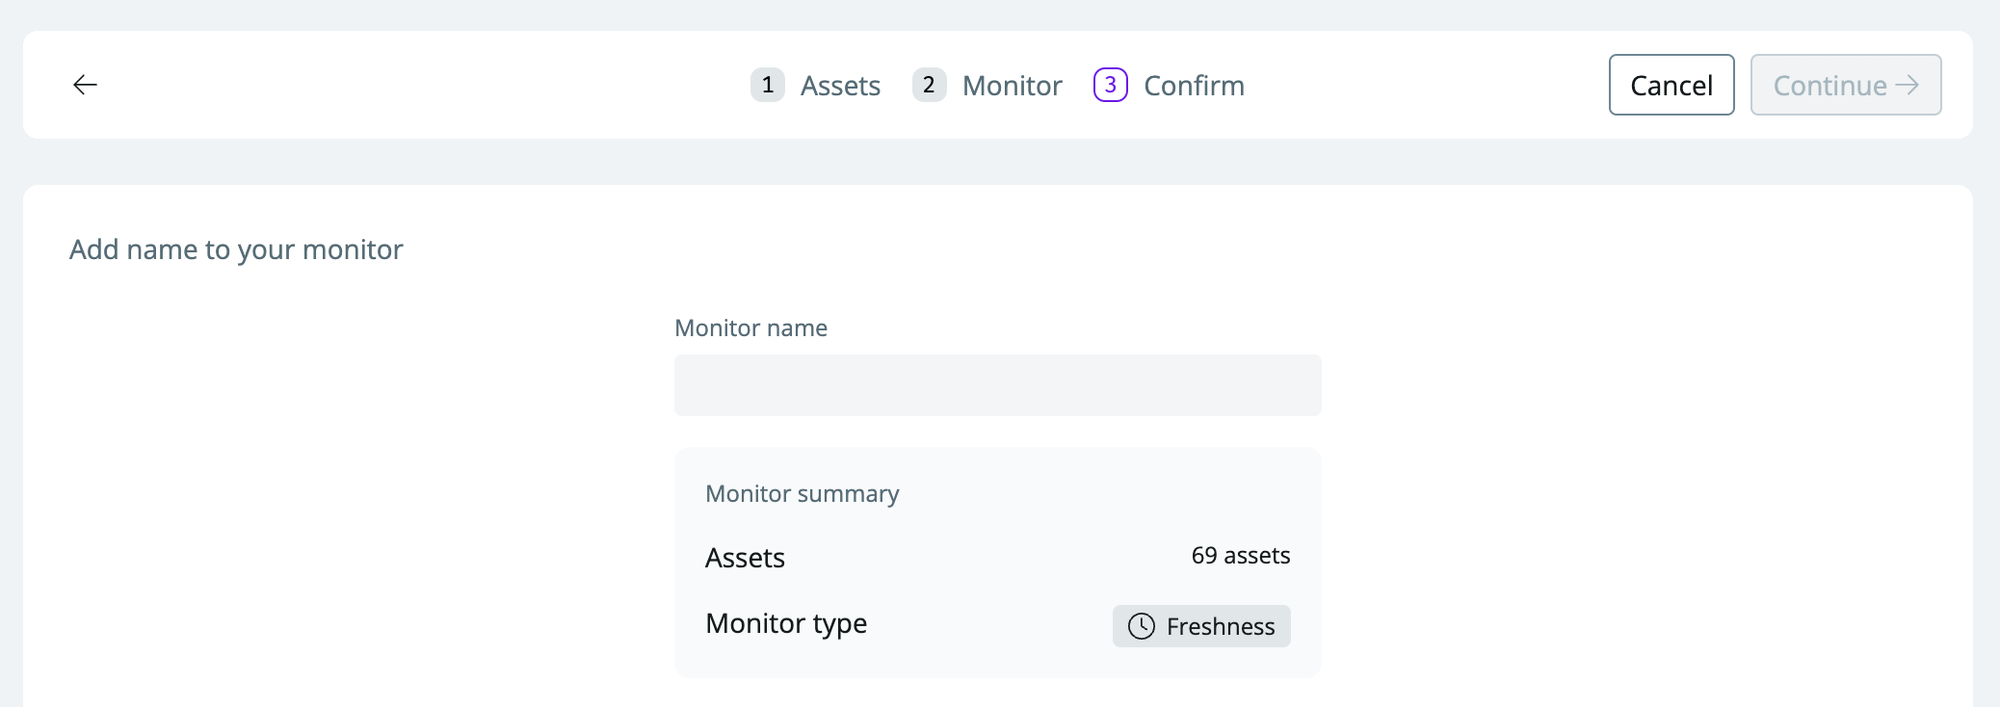
- Click
continueto set up the monitor
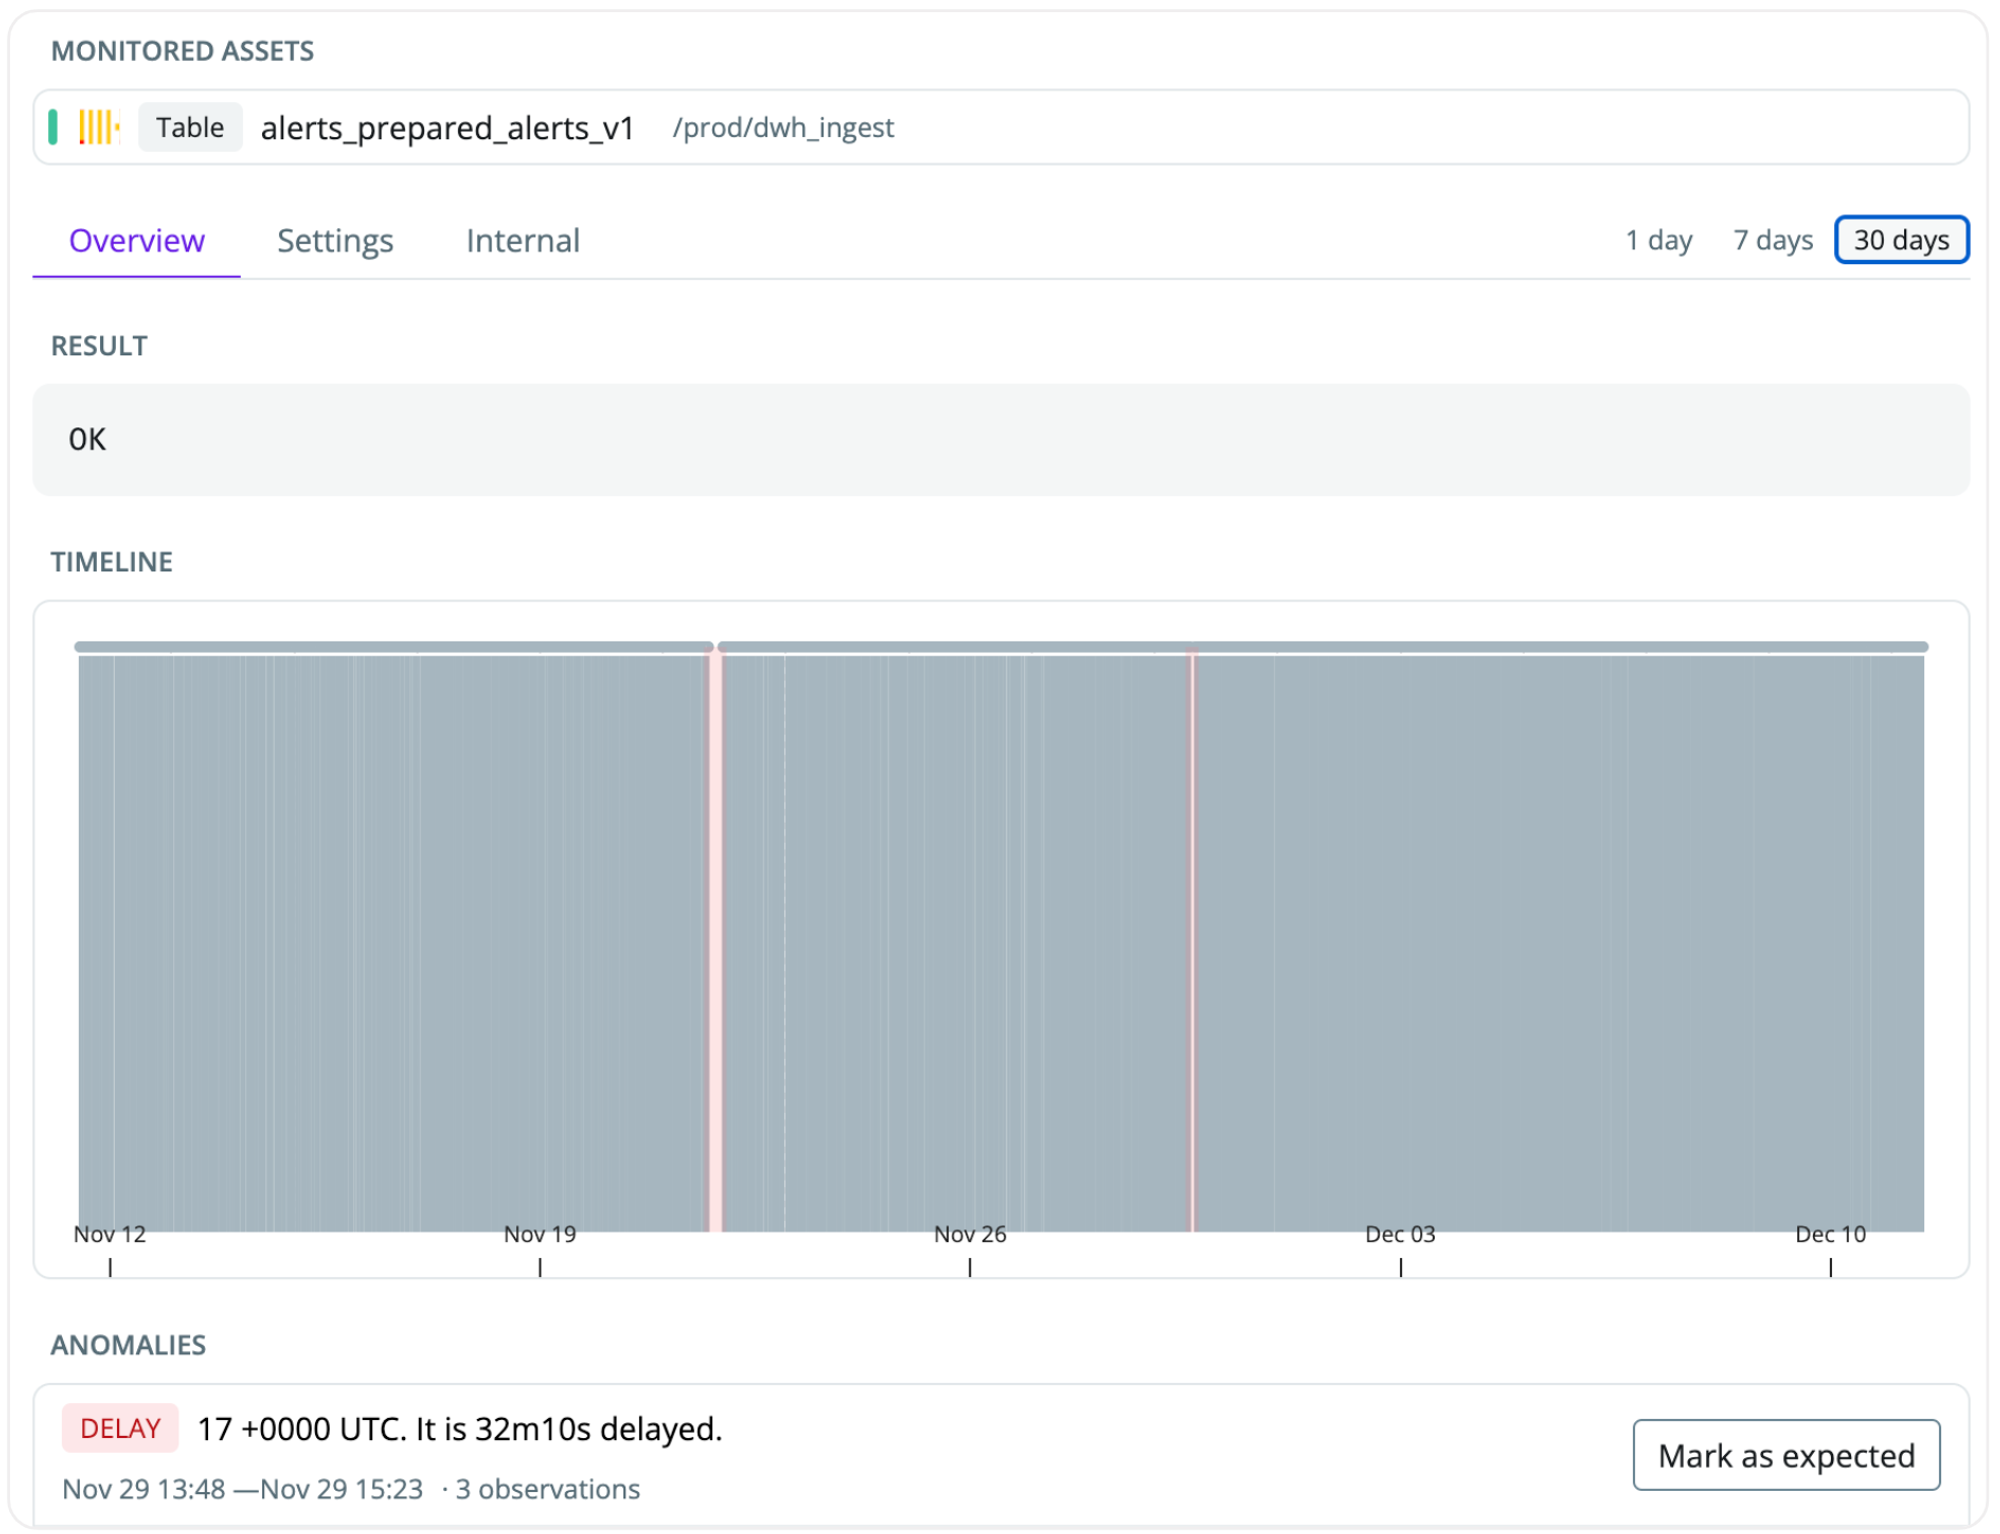
As soon as you’ve set the monitor up, it will start learning the behaviors of your data every hour. You should expect ~10 days before the monitor has built an understanding of the seasonality and patterns in your data and is confidently able to predict anomalies