- Ensure the accuracy of a key ML input numeric feature by creating a monitor to track the feature average over time
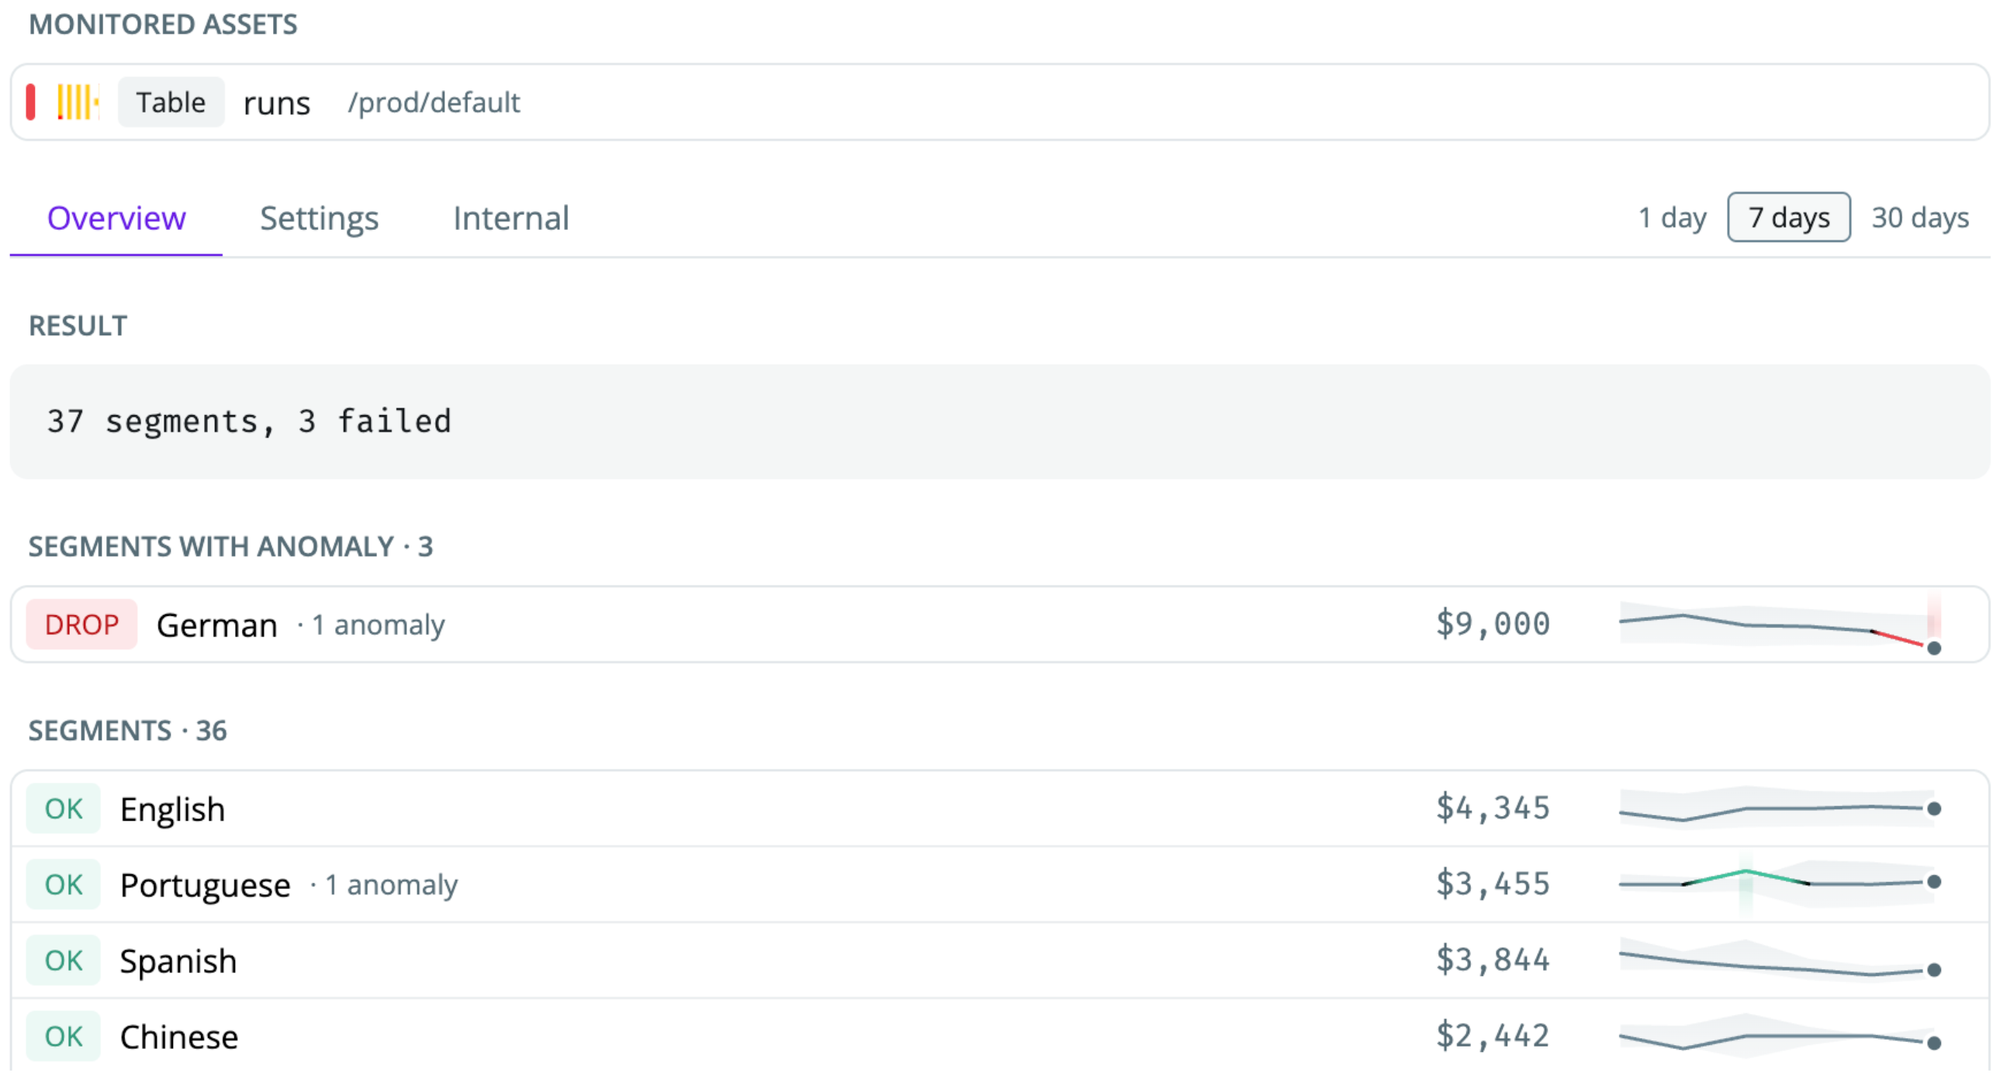
- Set up a monitor on average revenue grouped by geography to learn about sudden increases or drops for a specific region
- Detect unexpected patterns in the number of unique users created at the source level to prevent downstream impact
Setting up a custom SQL monitor
-
Navigate to the table or transformation model (dbt model, SQLMesh model, Coalesce node) where you want to set up the monitor and click
Add Monitor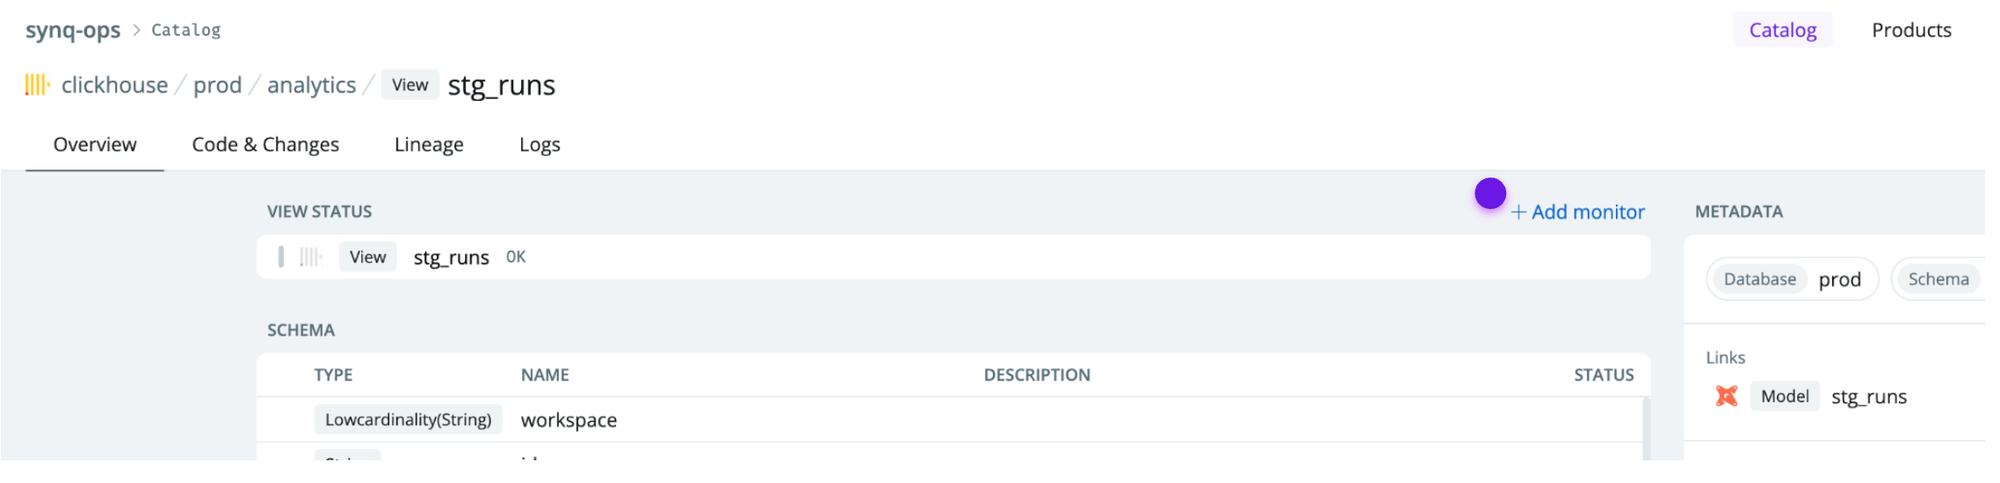
-
Select
Custom SQLto start creating a custom SQL monitor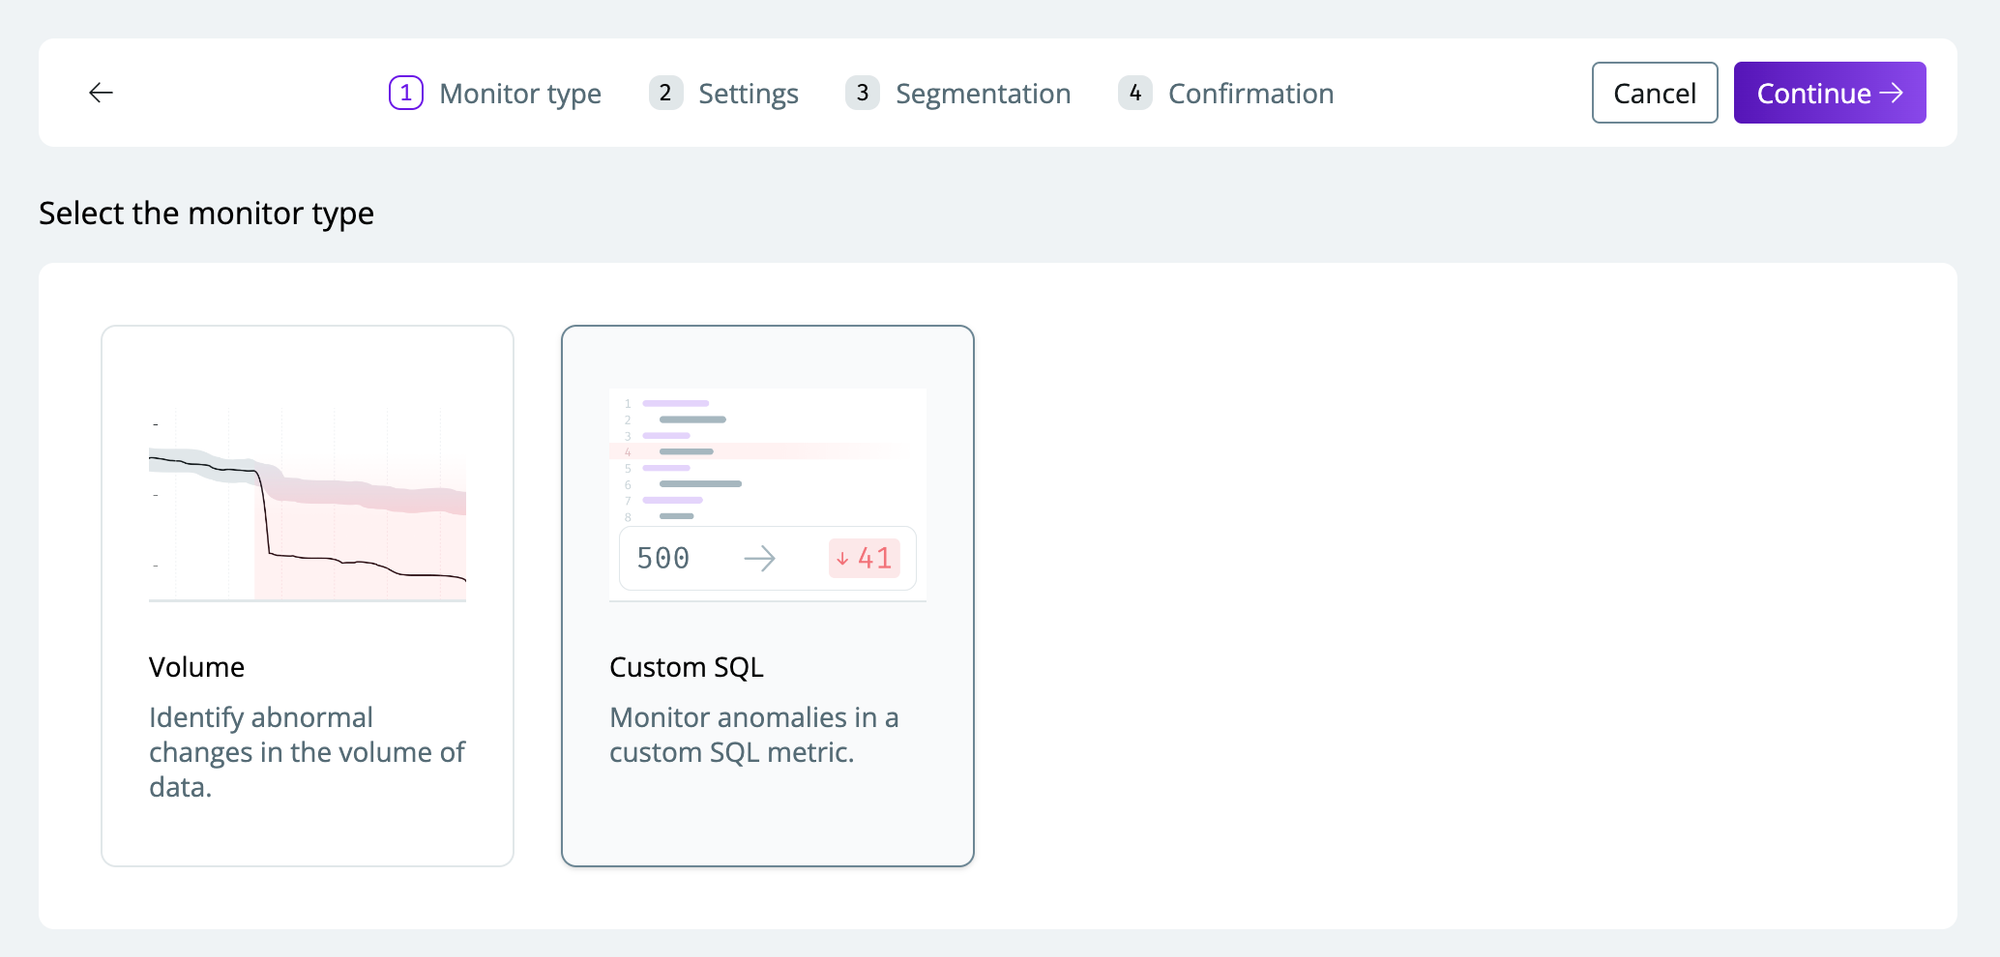
-
Configure the monitor with the relevant settings
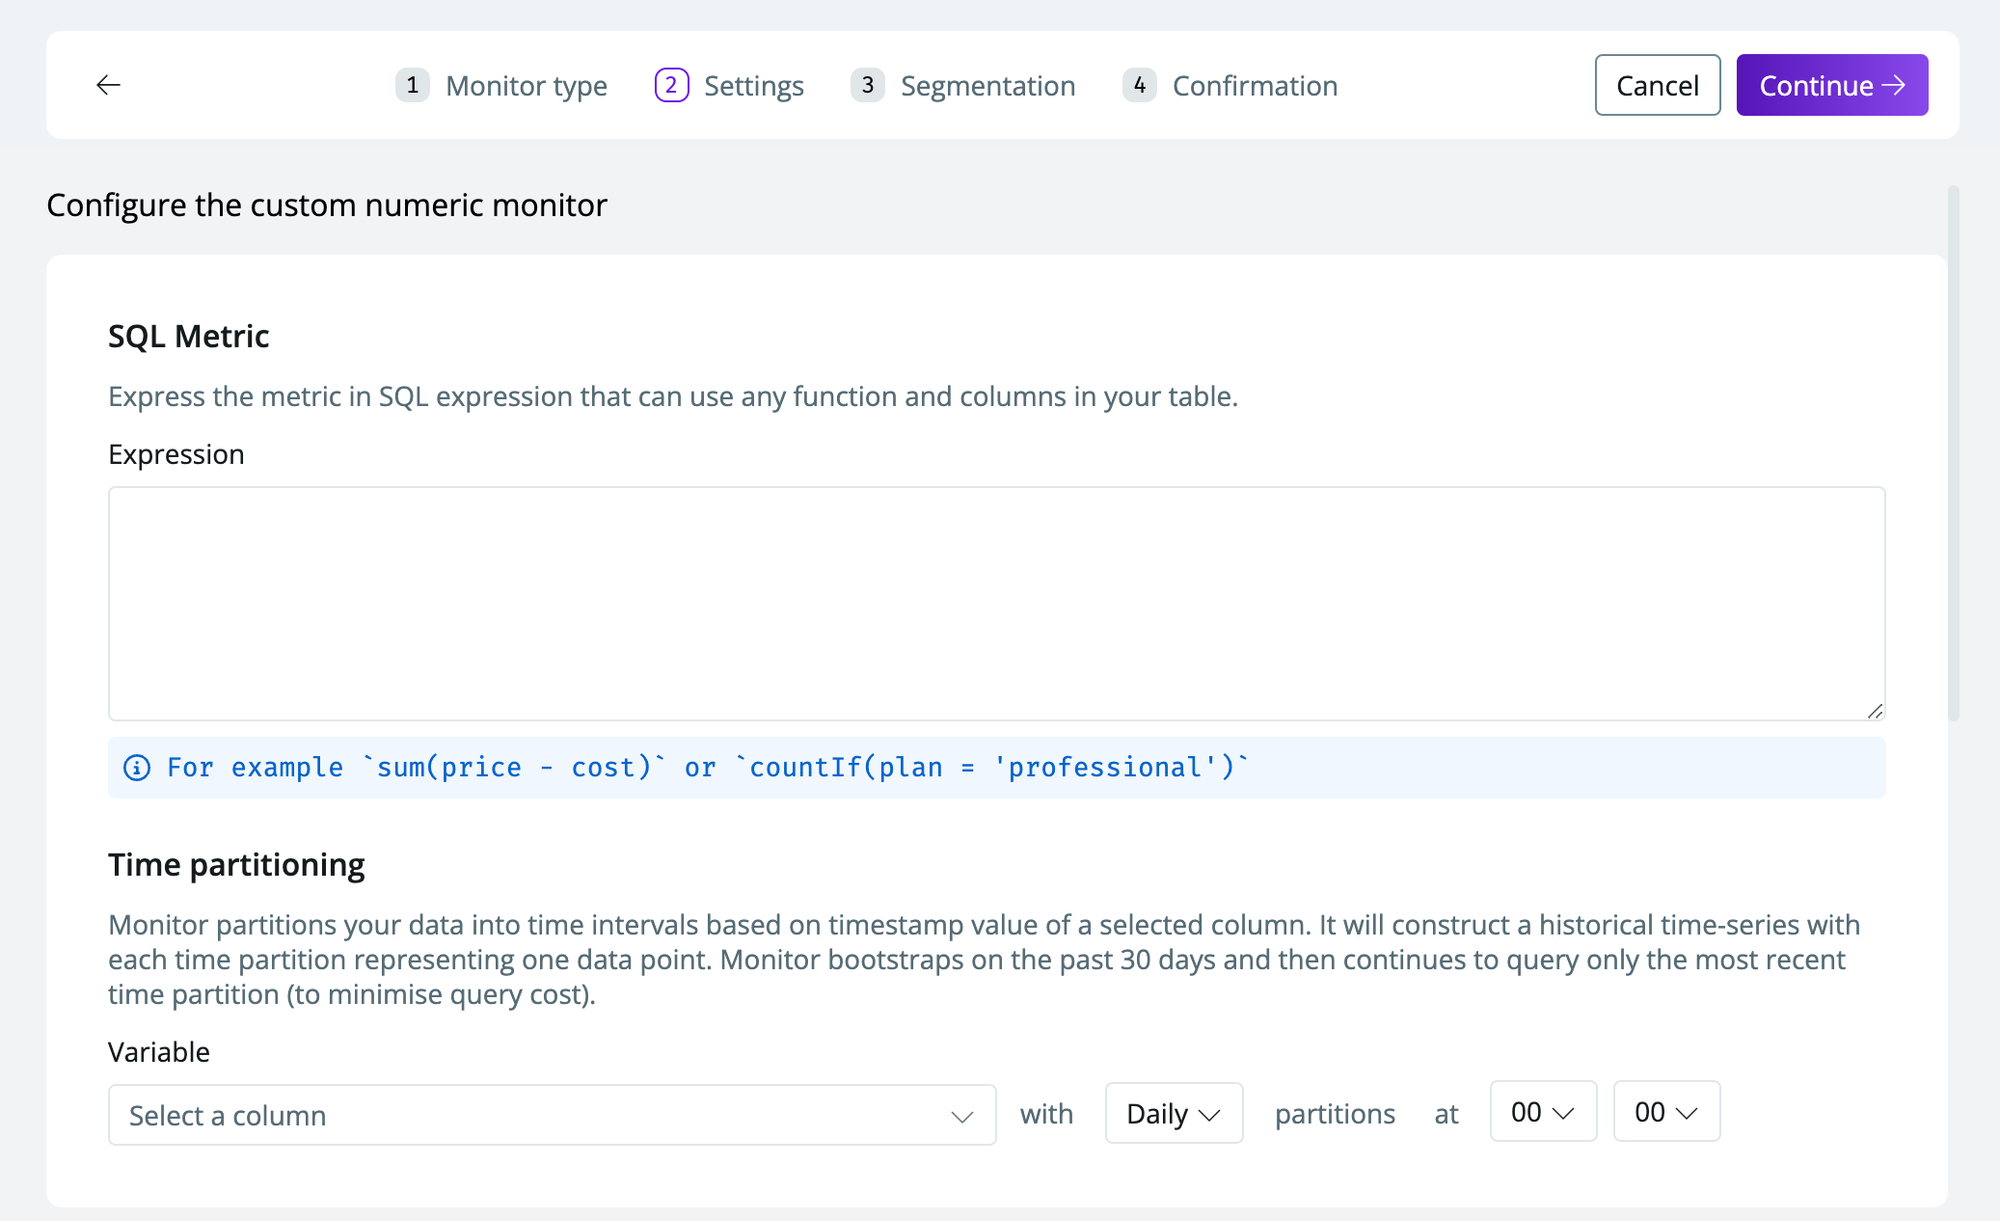
- SQL metric—any SQL expression that specifies the metric to track (e.g.,
avg(revenue)). This must be an expression that results in a metric - Time partition—the time partition you want your data segmented by (e.g., creation_date)
- Days to delay—days to ignore if you have a delay in when you expect fresh data
- Sensitivity-see Configuring sensitivity
- Custom filter-specify filters using SQL
- SQL metric—any SQL expression that specifies the metric to track (e.g.,
-
Select a
variableto segment by (optional). This will create multiple time series for each segment you select to include- To create a monitor for specific segments, toggle
Selected valuesand select the desired values. - If you select
All values, new values are automatically added.
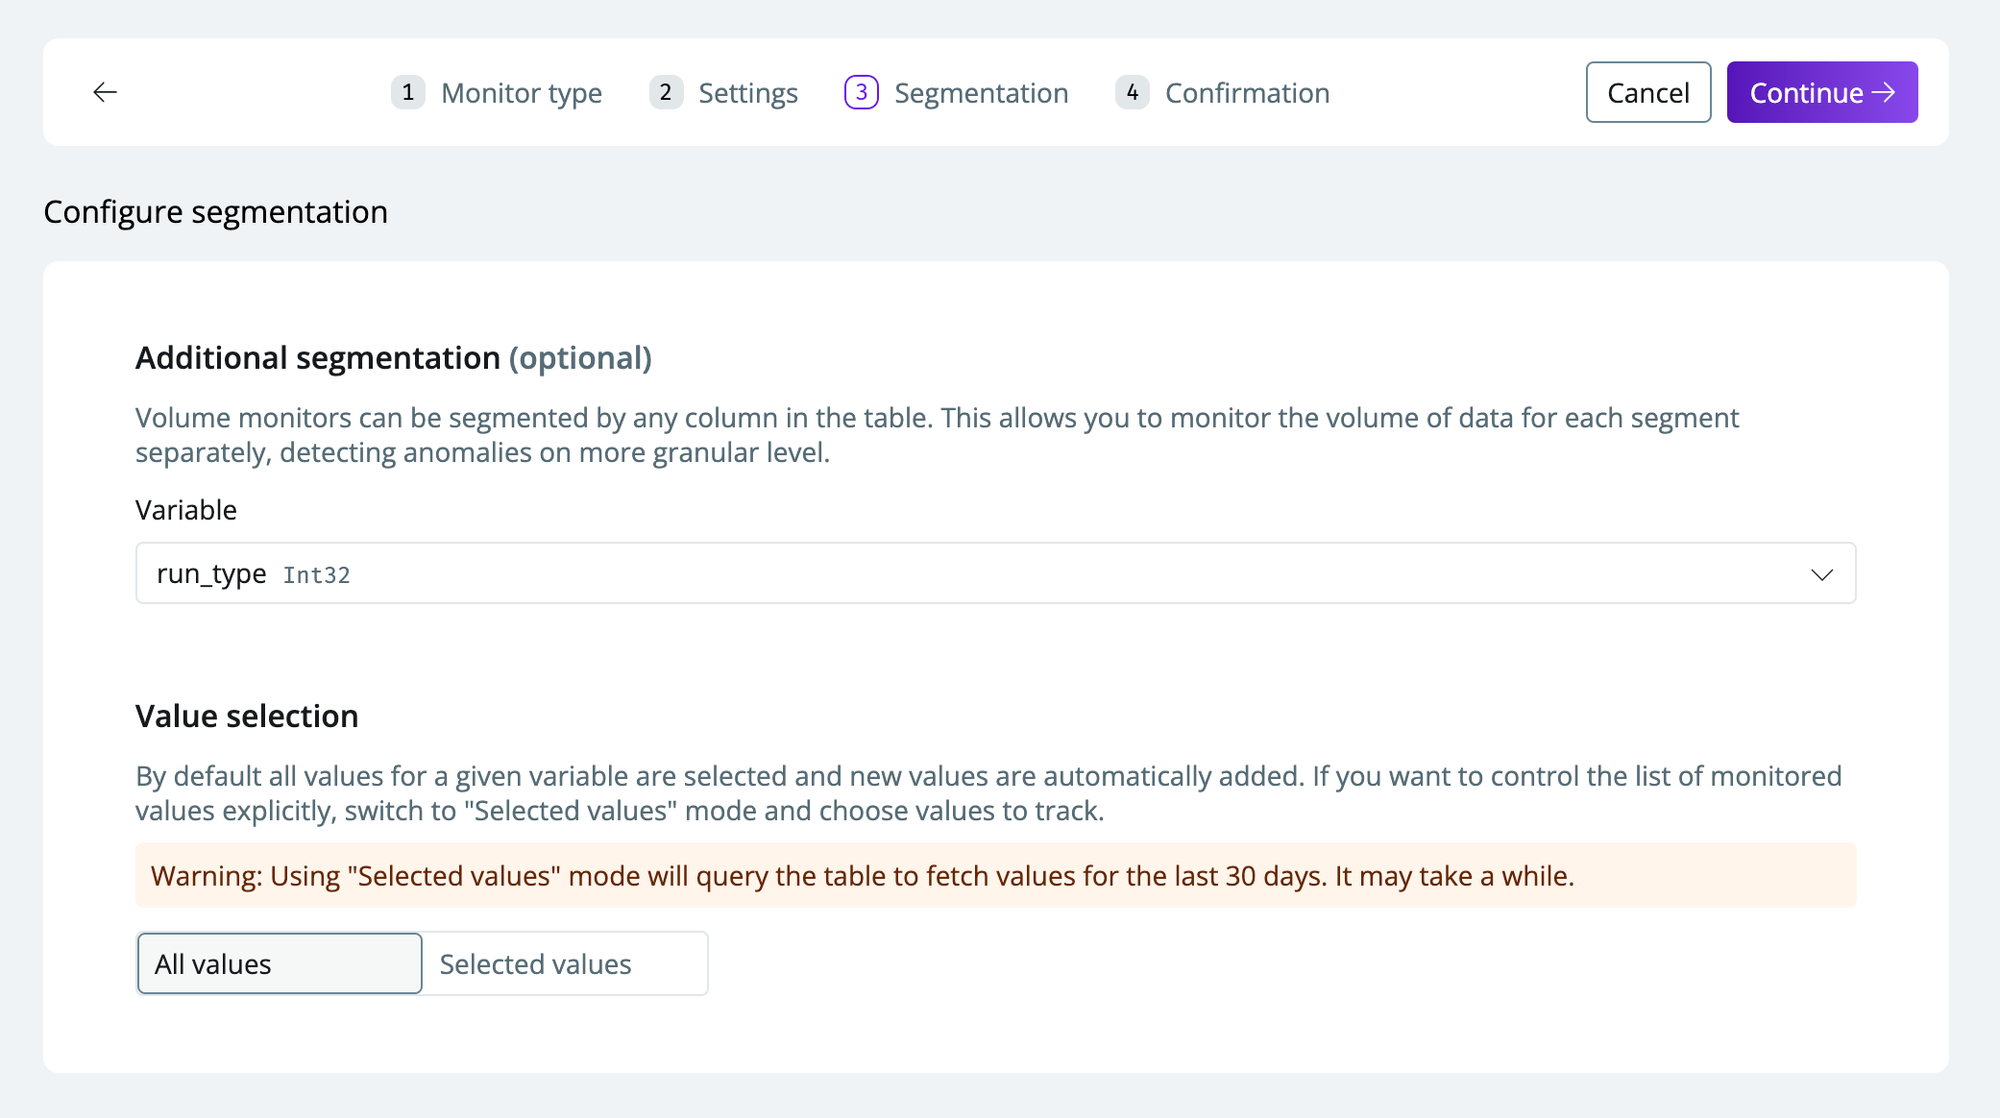
- To create a monitor for specific segments, toggle
-
Click
continueto set up the monitor with the specified configurations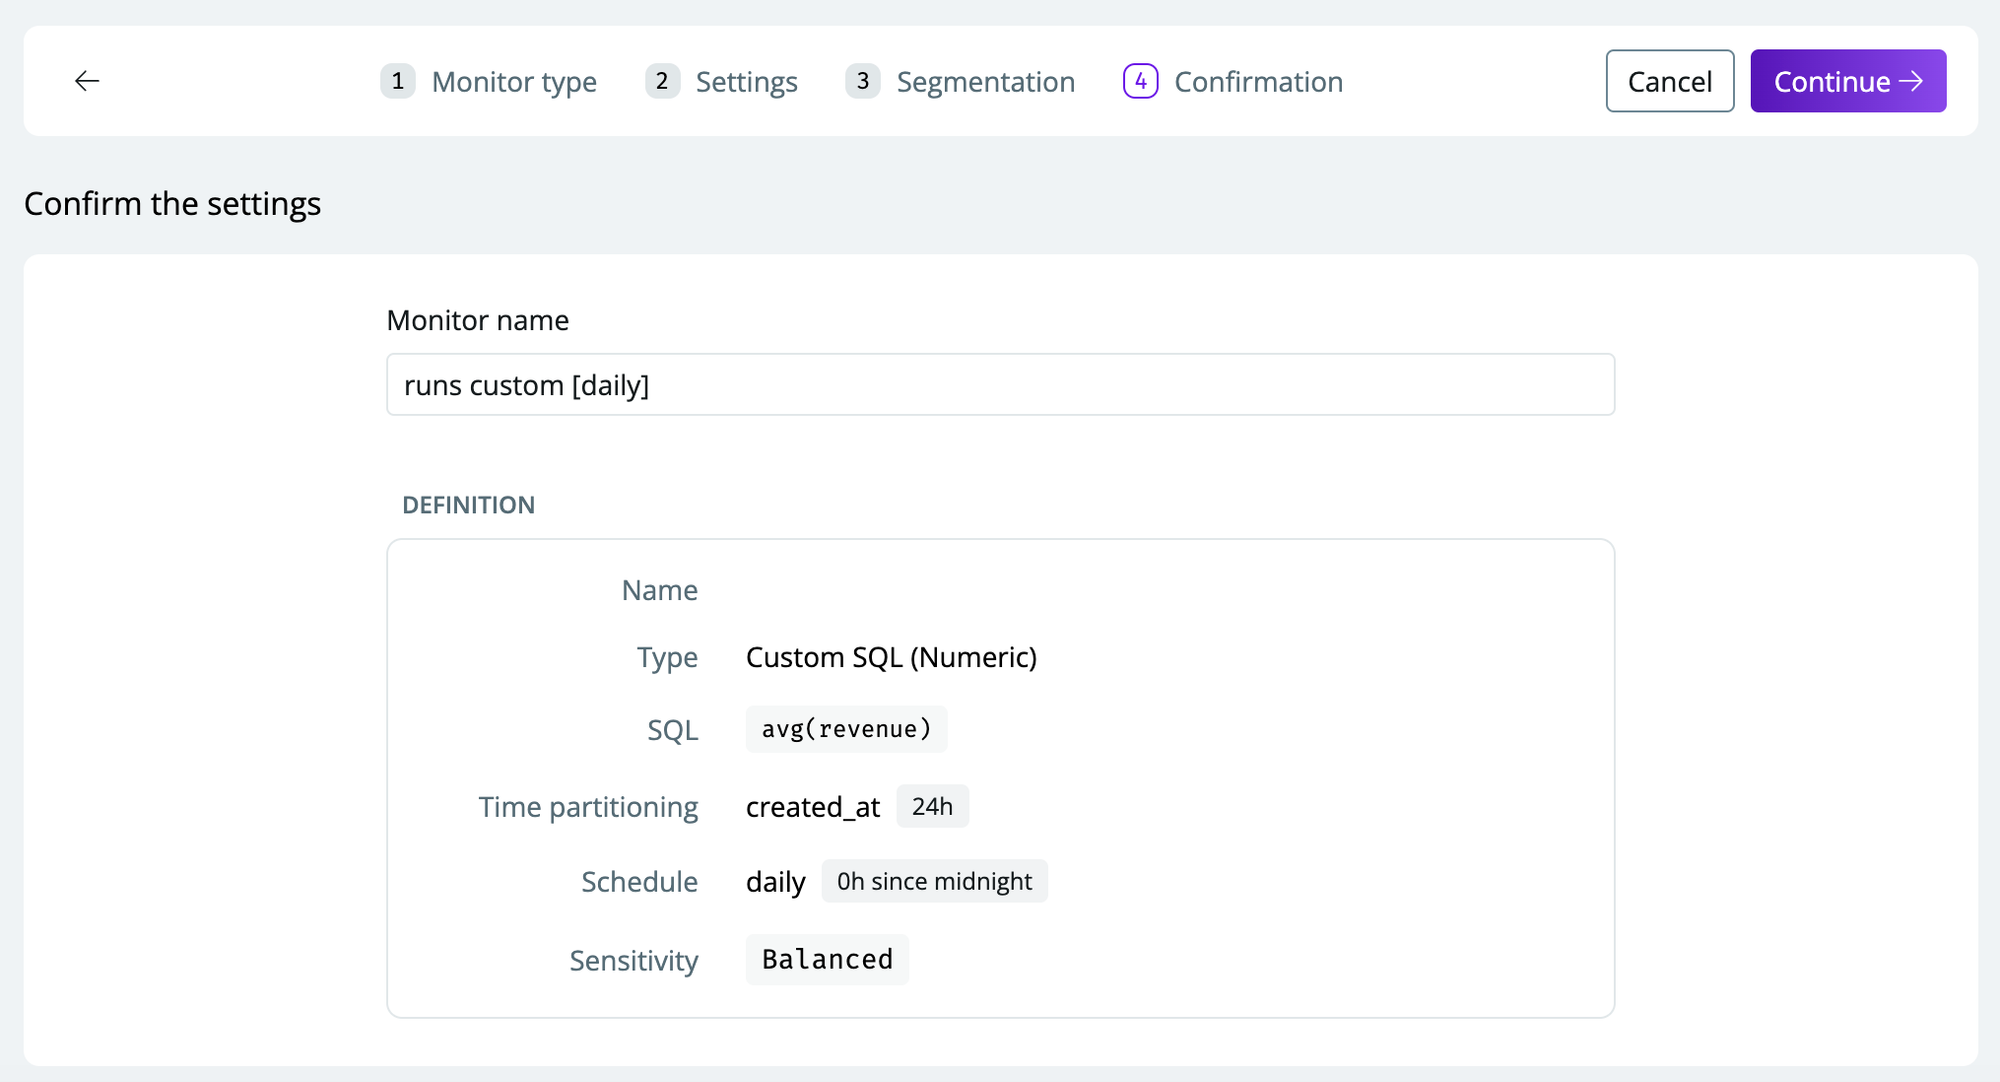
Custom monitors partition your data into time intervals based on the timestamp value of a selected column. It will construct a historical time series, with each time partition representing one data point. Monitor bootstraps on the past 30 days and then continue to query only the most recent time partition (to minimize query cost). This means the monitor can detect anomalies right after setting it up.
Settings, and press Reset monitor. This step is not reversible to only proceed if you’re certain you want to reset the monitor.