Deployment Rules define where and how monitors apply across your data stack. Instead of manually adding individual monitors, you can set up rules that dynamically apply the right monitors based on your data source, Data Product, or specific table groups.
Key Benefits:
- Faster setup – Apply monitoring in bulk instead of configuring each asset manually
- Better control – Adjust sensitivity and thresholds across multiple monitors at once
- More flexibility – Define and manage exclusions and overrides
Setting Up Deployment Rules
-
Navigate to
Deployment Rules under Health
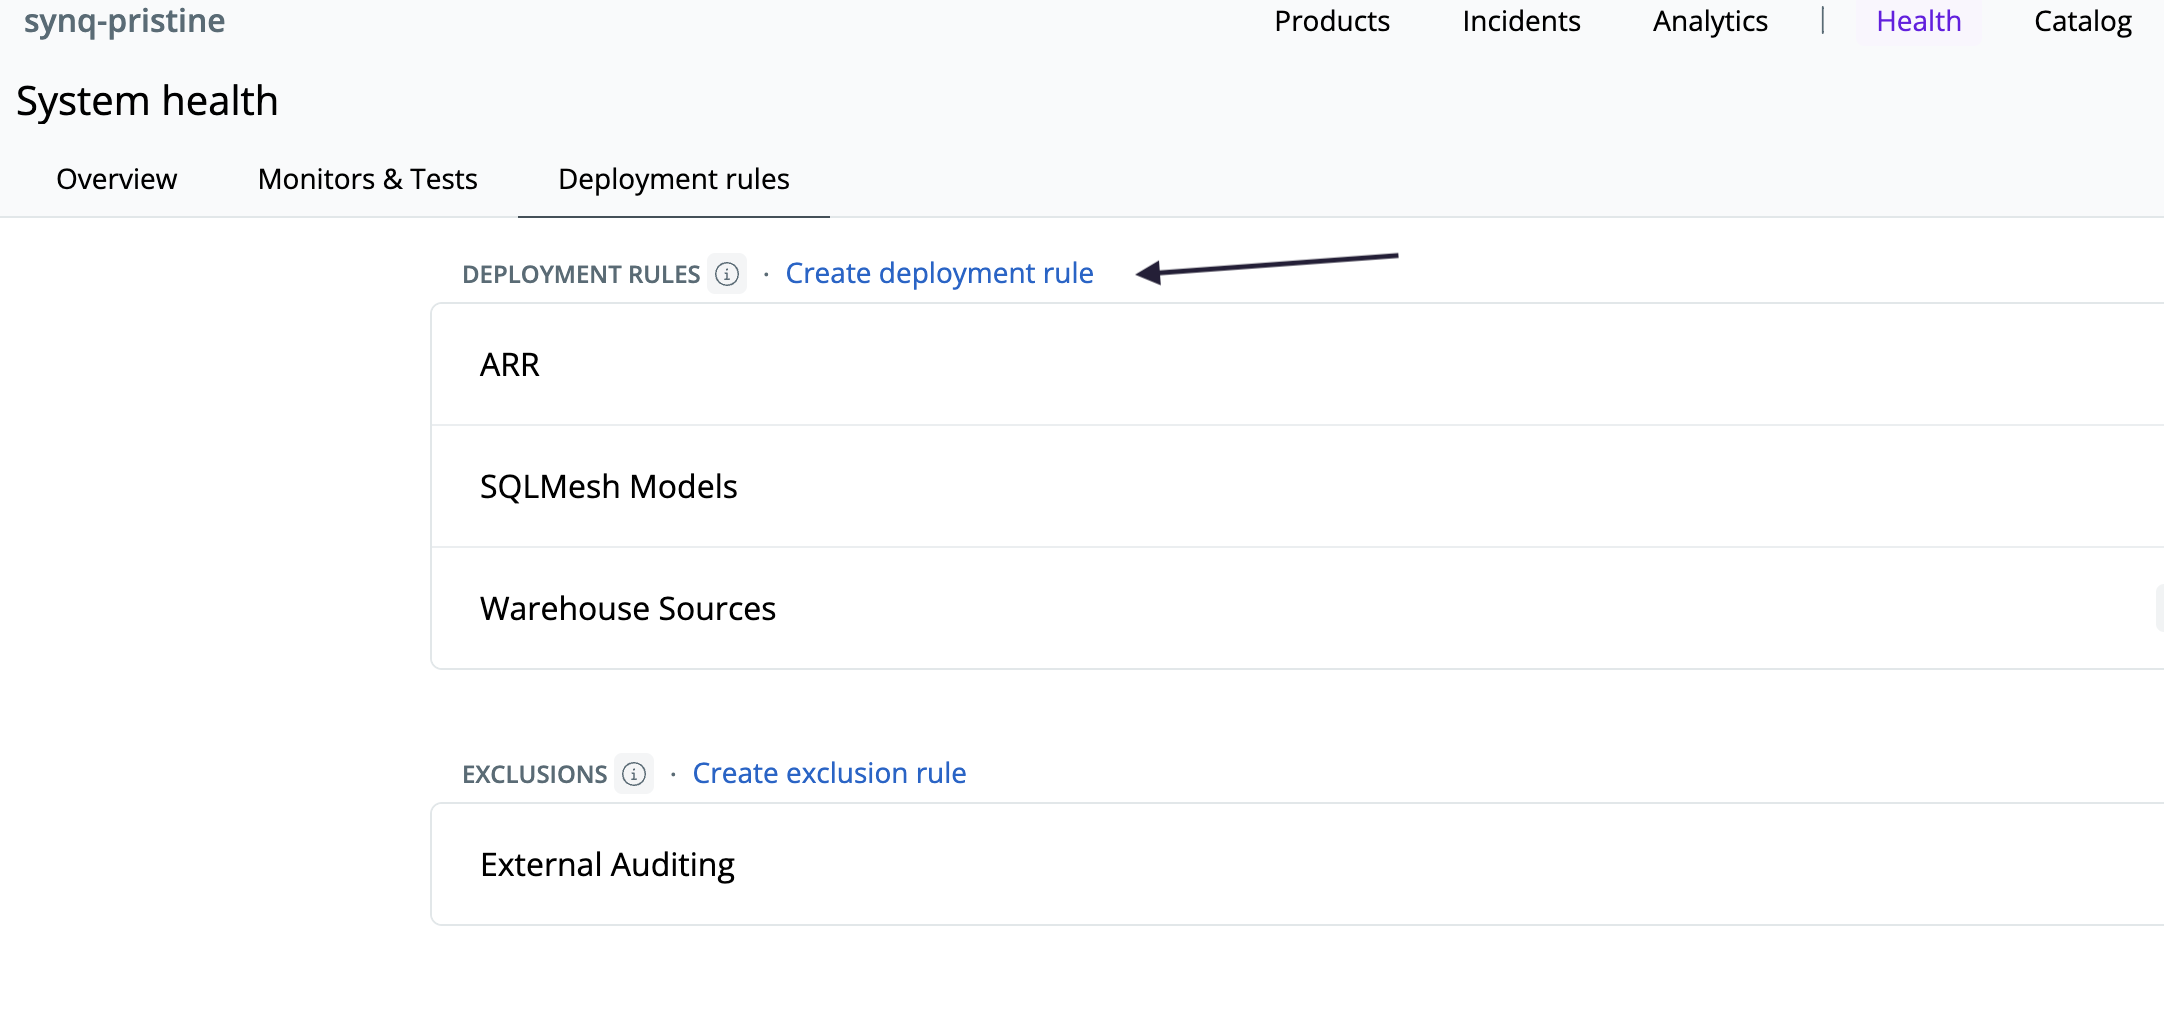
-
Click Create Deployment Rule
-
Choose the
Sensitivity (read more), Severity, and Metrics (read more)
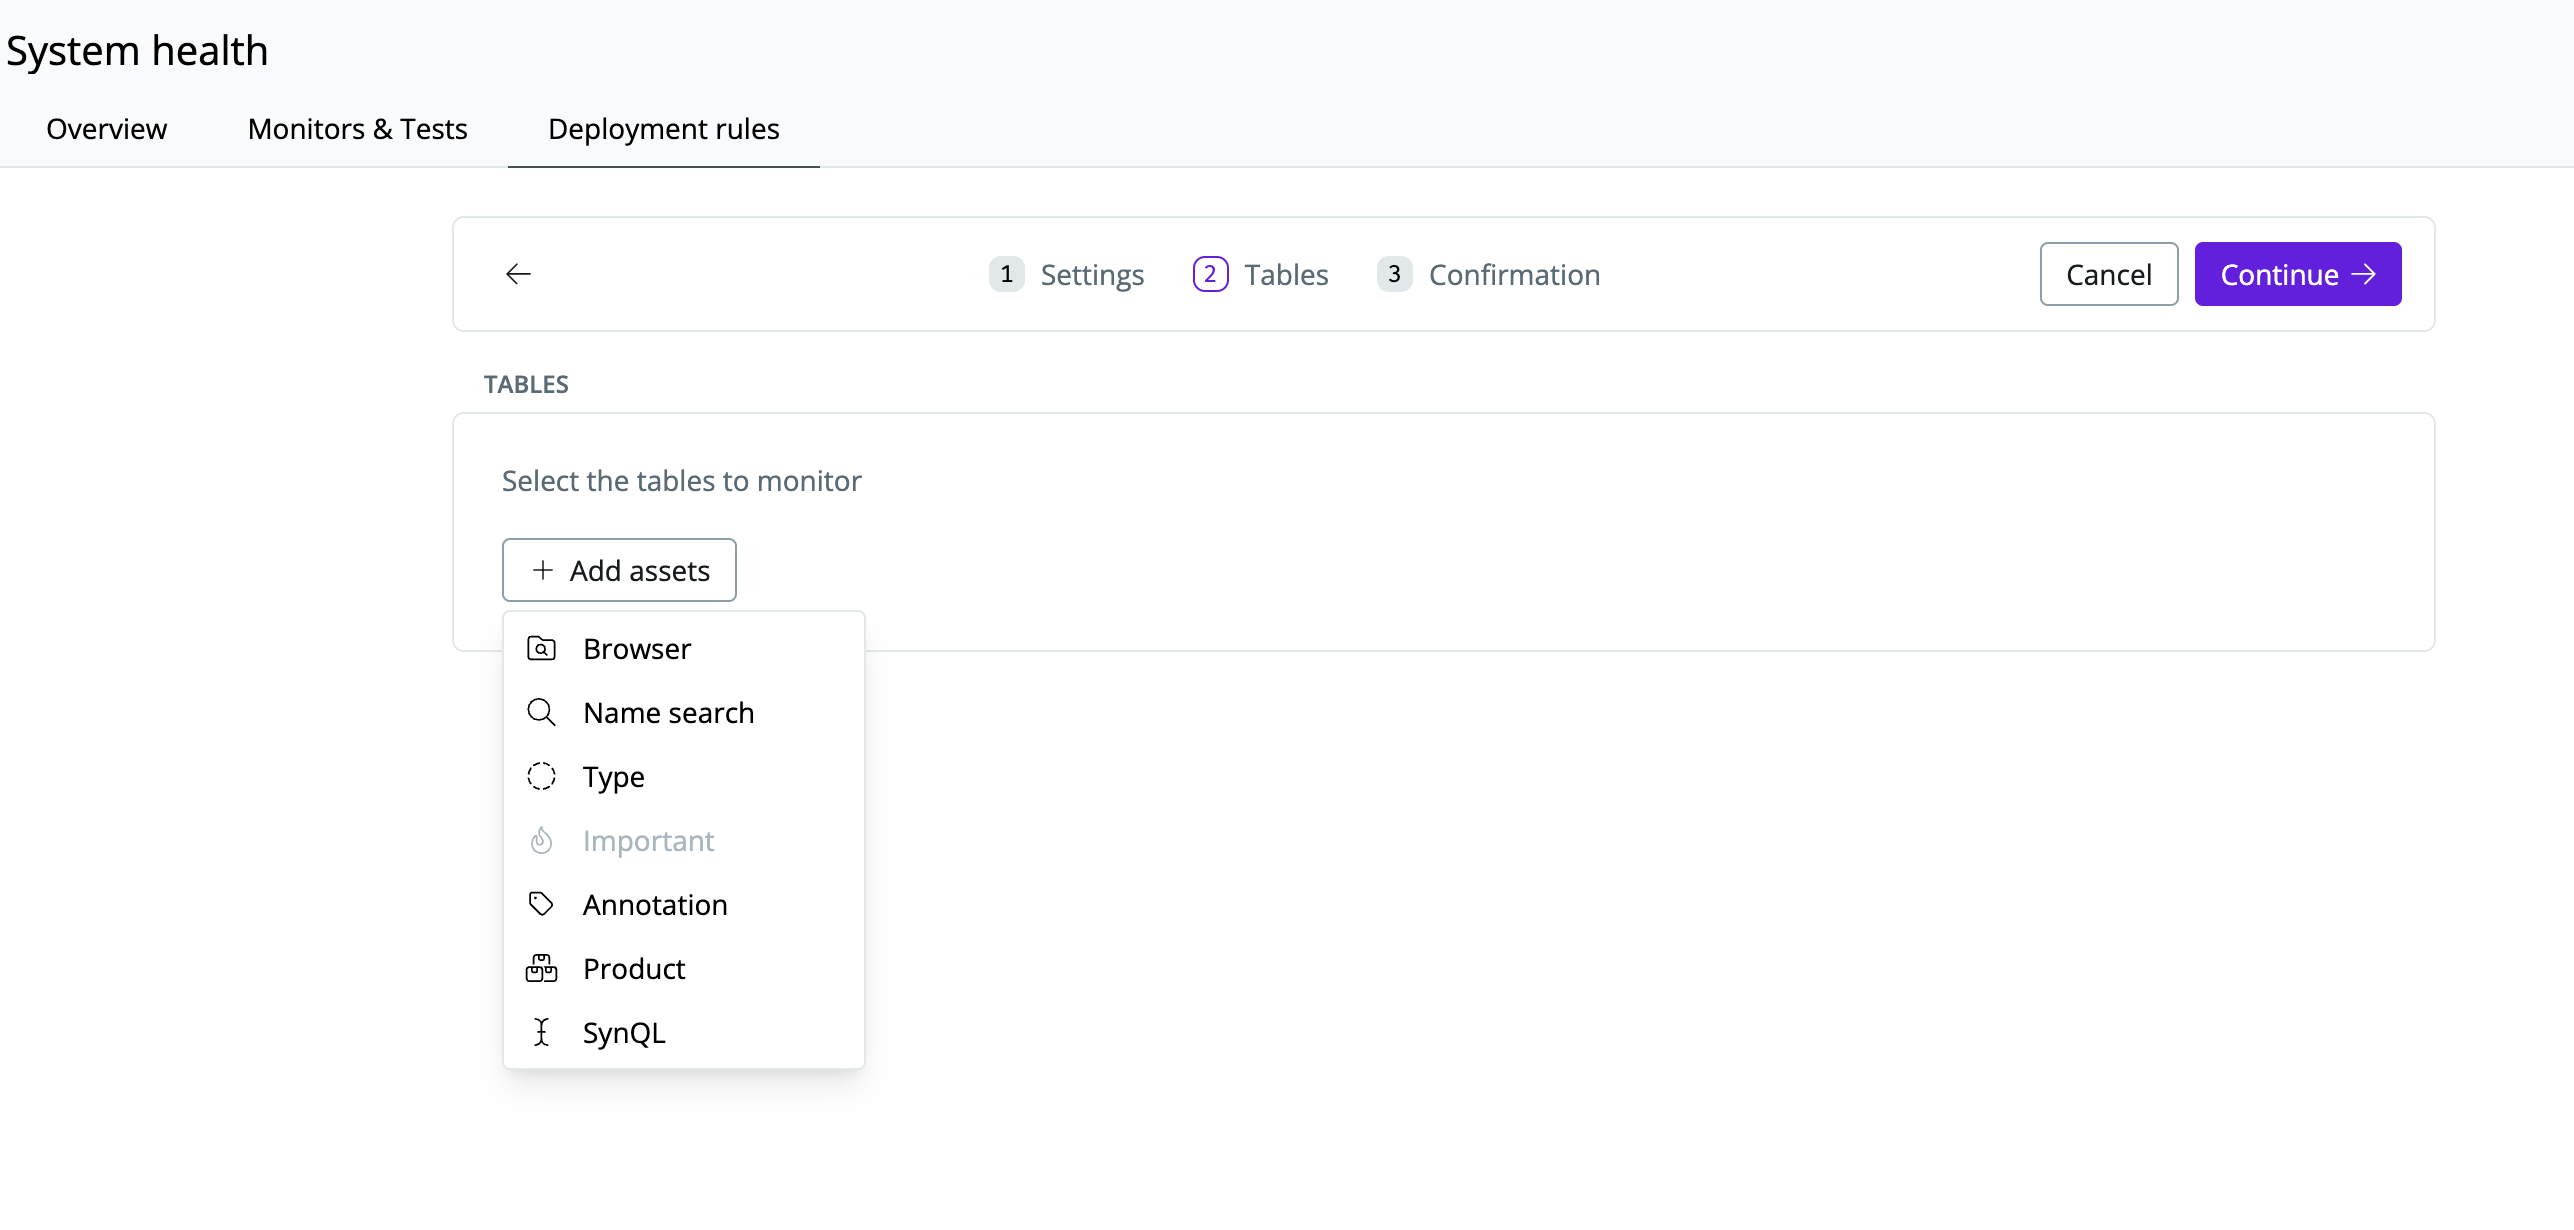
-
Select the assets you want to monitor
Avoid applying rules too broadly—too many alerts can lead to noise. Use exclusions and overrides to refine rule coverage.
- You can also set up Exclusion rules to exclude specific assets from a rule under the
Deployment Rules page.
Adjusting & Managing Deployment Rules
Once configured, Deployment Rules will automatically apply monitoring. However, you can still refine them. On the Deployment rules page:
- Edit a rule to add/remove assets
- Change sensitivity settings if alerts are too frequent or too infrequent
- Disable a rule if it no longer applies
Best Practices for Deployment Rules
See Monitors overview for best practices when setting up monitors. Specifically for deployment rules, we recommend you consider:
- Use exclusions to reduce noise - remove temporary tables, or datasets where fluctuations are expected.
- Override sensitivity - for example, for financial data configure tighter alert thresholds to detect even small anomalies. For less important data set a looser threshold to only get alerted on significant deviations.