- A source that’s entirely stopped sending data
- A source that’s sending significantly fewer/more rows
- A join that causes a spike in duplicate values
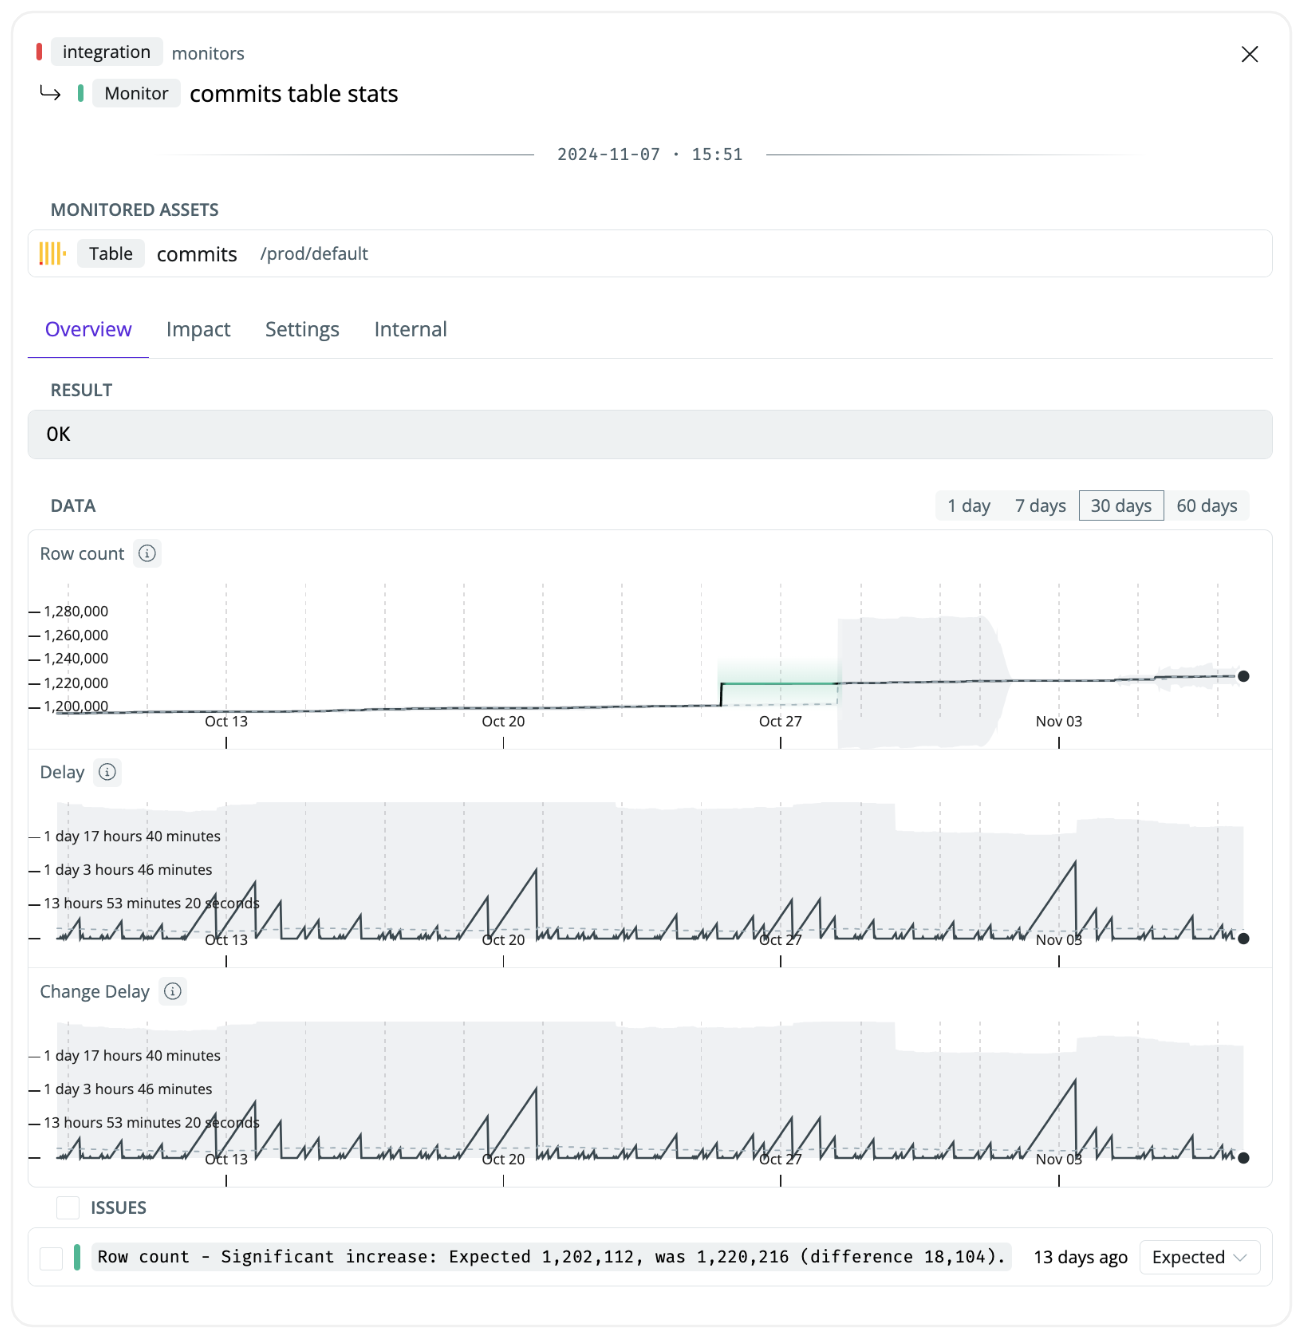
- Row count — the count of rows in the dataset
- Delay — the delay since the last time data was loaded
- Change delay — the delay since the last data load when at least one row was loaded
row_count from the Snowflake table information schema. As the monitor queries the information schema, you only incur minimal additional costs even when they are run frequently. The monitor works out of the box, which makes it easy to deploy at scale.
Setting up a table stats monitor
- Navigate to
Health→Manage monitors - Click
Create monitor groupto define the tables you want to monitor - Use the browser to narrow down the tables you want to monitor
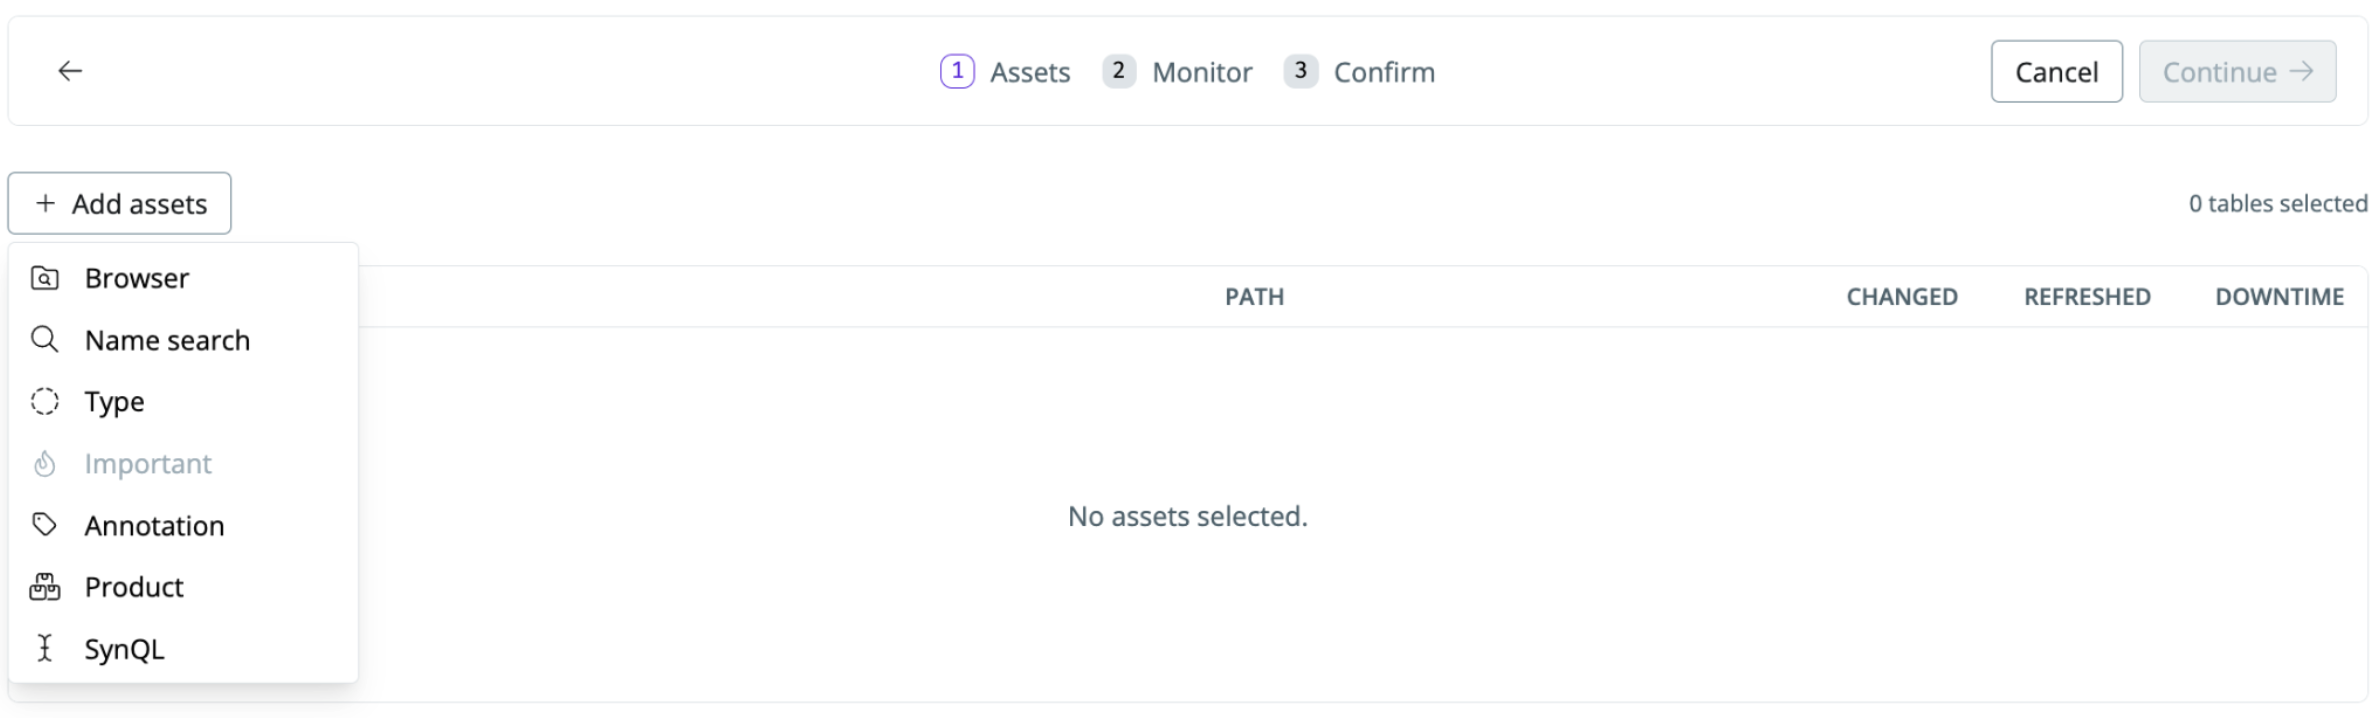
- Browser—select specific schemas or search for tables to monitor (your data warehouse tables and transformation models from dbt, SQLMesh, and Coalesce Transform are automatically mapped)
- Type—data asset type such as dbt source, Coalesce source, or SQLMesh external model
- Annotation—select assets with metadata definitions such as tags defined in your transformation layer (dbt, SQLMesh, or Coalesce Transform)
- Important—select assets that you’ve marked as important
- Product—select a data product to place monitor on or upstream of
- SynQL—advanced selection. E.g., search for specific keyword matches
-
Check
Table Statsto set up a table stats monitor group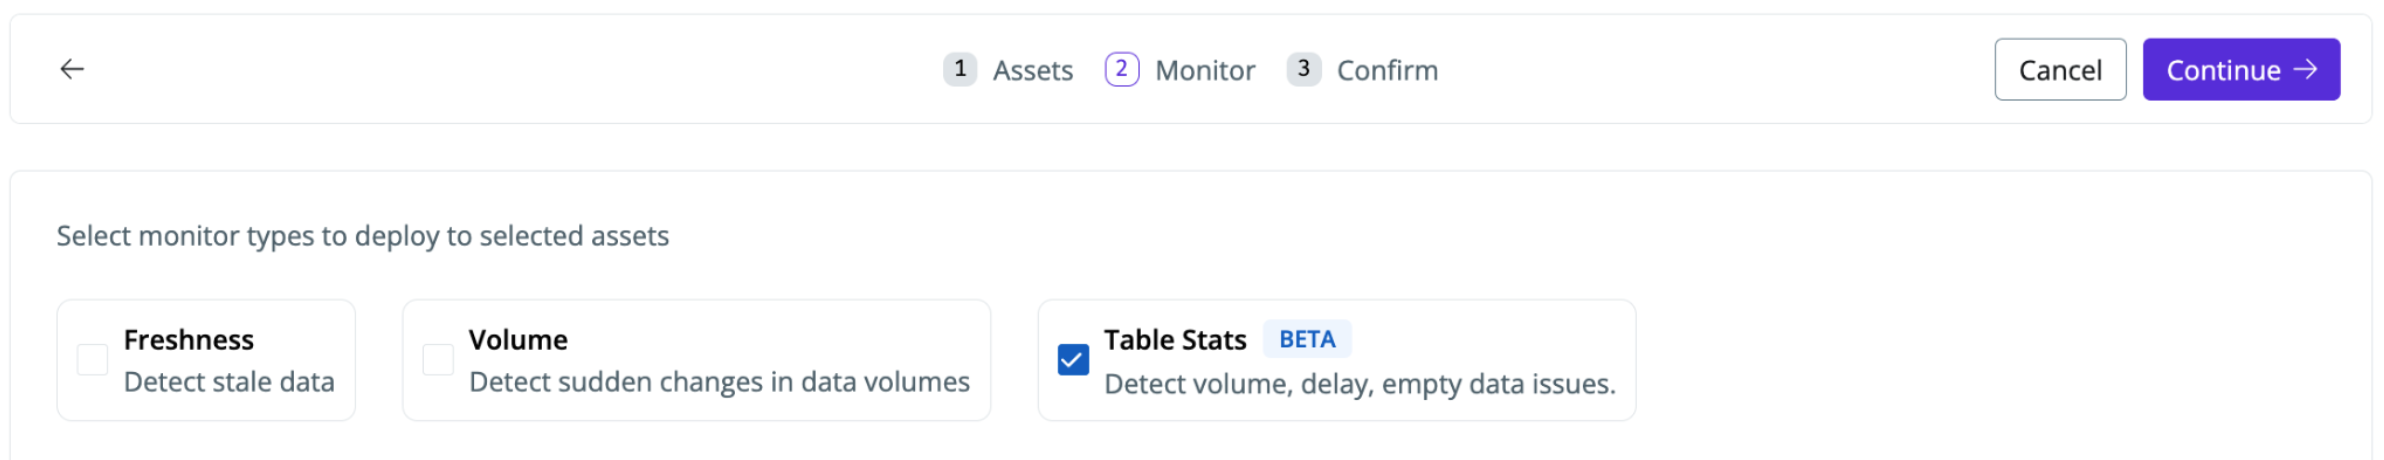
-
Name the monitor (e.g., important sources).
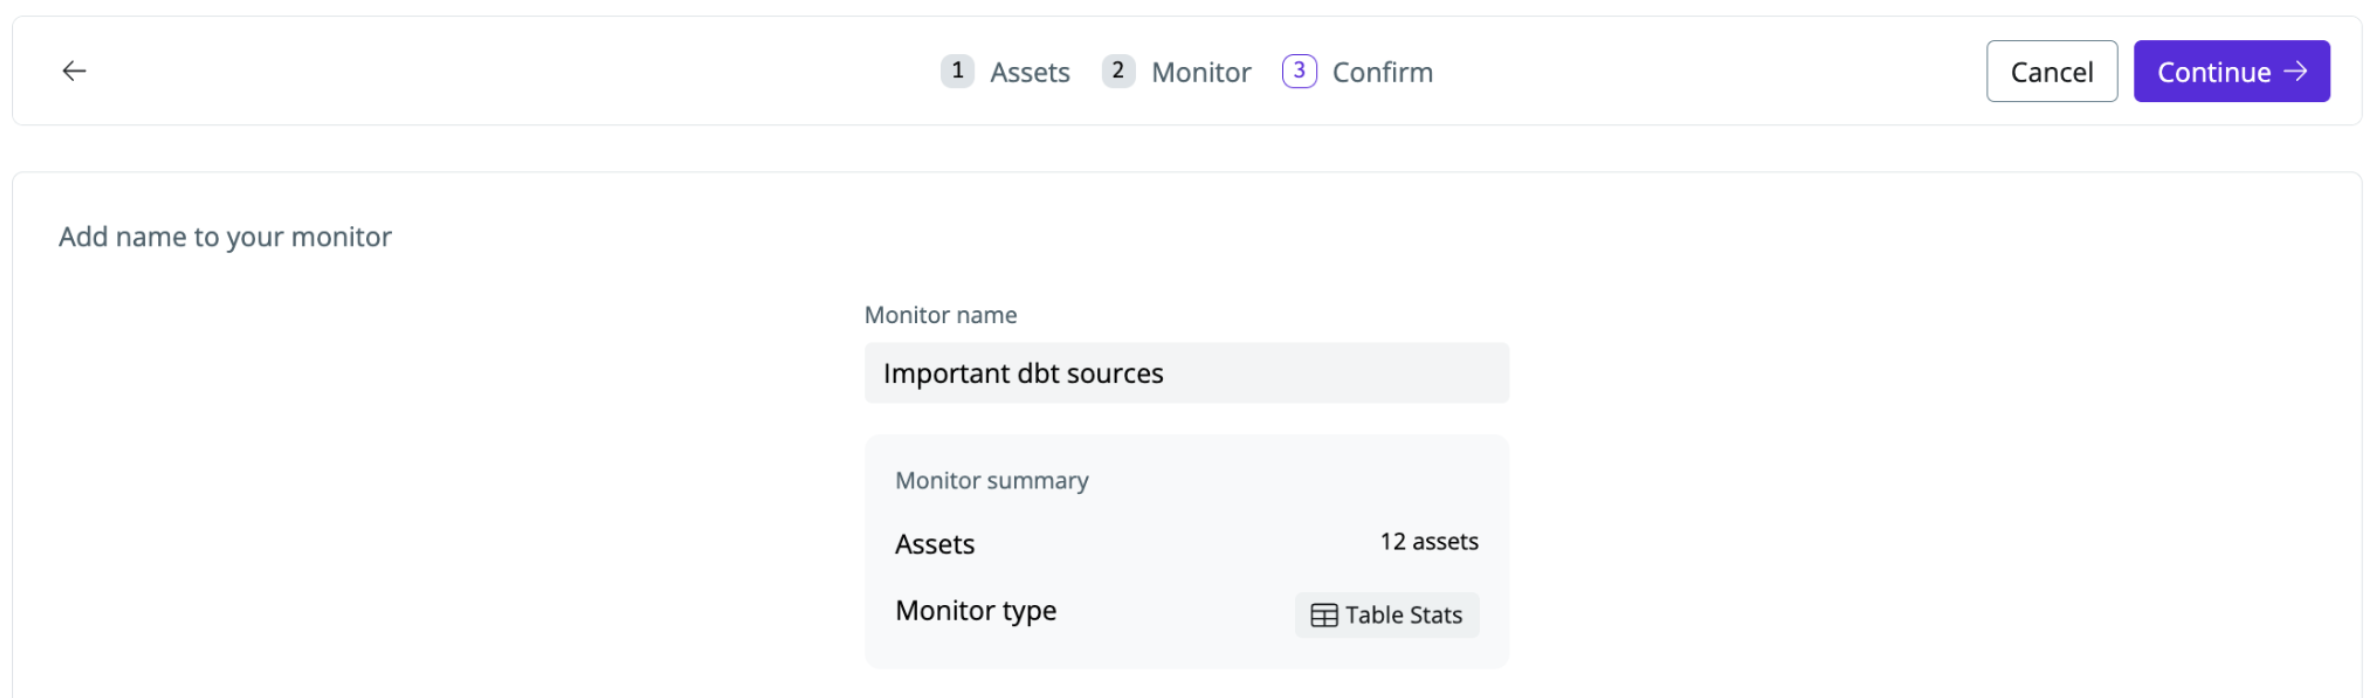
-
Click
continueto set up the monitor