> ## Documentation Index
> Fetch the complete documentation index at: https://docs.synq.io/llms.txt
> Use this file to discover all available pages before exploring further.
# Defining monitors in code
Instead of defining your monitor placement specifications in the UI, you can also provide a YML file to specify where to place monitors programmatically. This is beneficial if you prefer to manage monitor placement through code, e.g., enforce it through your CI/CD development process.
## Getting started
1. Install the [CLI](https://github.com/getsynq/synq-monitors?tab=readme-ov-file#custom-monitors-management-cli)
2. Set up an [API Client](https://app.synq.io/settings/api) by clicking `Add client` with the following scopes
* `Edit SQL Tests`
* `Edit Automatic Monitors`
* `Edit Custom Monitors`
3. Run `synq-monitors` using the credentials from above
## Defining monitors in code
Create a YAML file where you'll be managing the monitor setup, for example, `synq_monitors.yml`. You can split your configuration up into multiple files and use namespaces to manage individual domains or data products independently.
**Using Namespaces**
Monitors in one namespace are isolated from those in another, which helps you:
* Avoid conflicts when multiple teams manage monitors in parallel.
* Keep different pipelines or environments separate (e.g., transformation models in CI vs. external tables in prod).
* Apply ownership, defaults, and alerts consistently within a group.
You can define a `namespace` at the top of your YAML file, or override it inside individual monitor definitions when needed.
Example content of the file
```
namespace: "data-team-pipeline"
defaults:
severity: ERROR
monitors:
- name: freshness_on_orders
time_partitioning: created_at
type: freshness
expression: "created_at"
monitored_ids:
- orders_table_eu
- orders_table_us
- name: volume_on_logs
time_partitioning: at
type: volume
monitored_id: log_table
segmentation: "country"
filter: "country IN ('US', 'CA')"
- name: stats_on_user_fields
type: field_stats
time_partitioning: registered_at
fields:
- age
- signup_method
monitored_id: users_table
mode:
anomaly_engine:
sensitivity: BALANCED
schedule:
daily: 0
- name: custom_numeric_active_users
time_partitioning: registered_at
type: custom_numeric
metric_aggregation: "COUNT(DISTINCT user_id)"
monitored_ids:
- active_users_table
mode:
fixed_thresholds:
min: 100
max: 10000
schedule:
hourly: 15
```
## Configuring a monitor
You can define all custom monitor types as code (`freshness`, `volume`, `custom_numeric`, and `field_stats`). [Read more about each monitor type](https://docs.synq.io/monitors/monitors-overview).
### Obtaining IDs from the UI
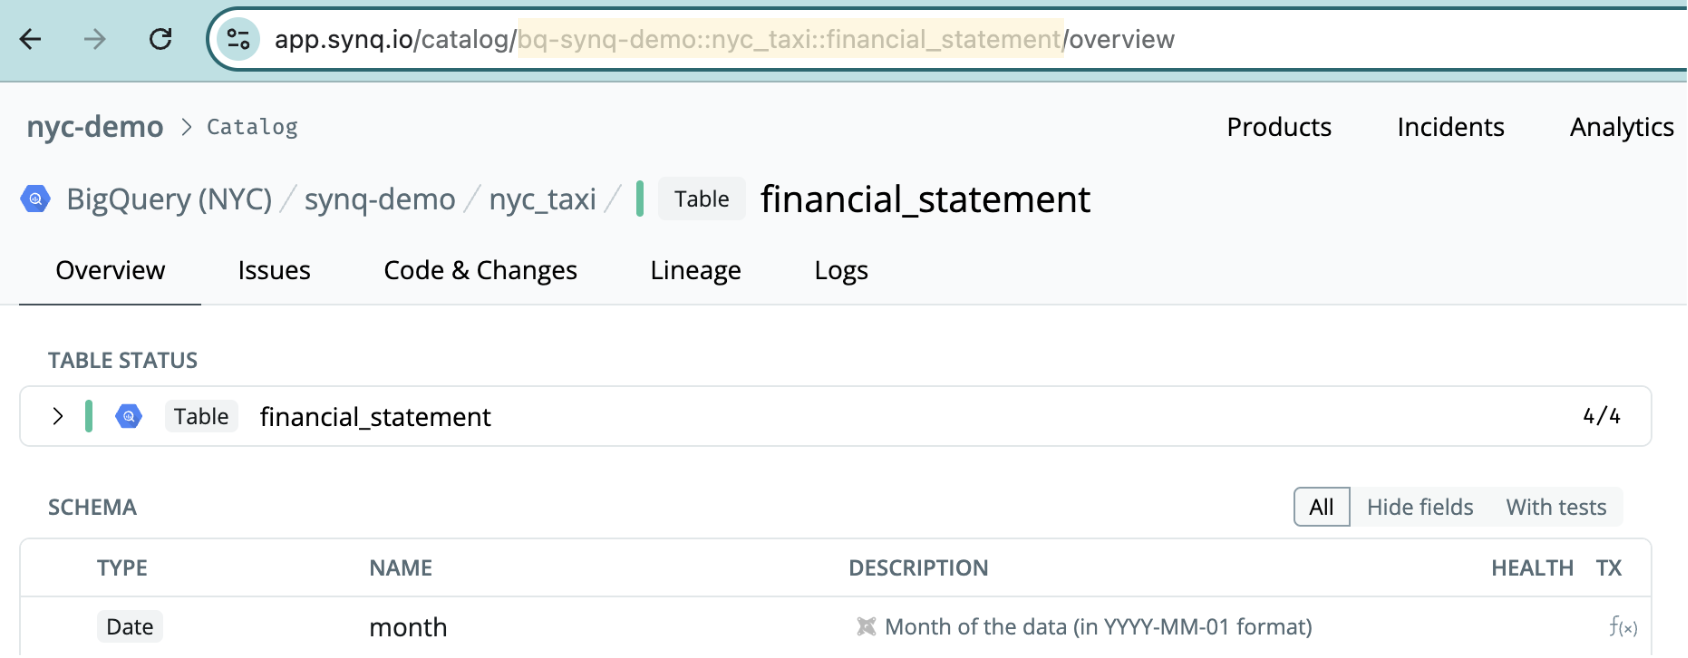
When configuring a monitor, `monitored_id` is the full table identifier as represented in the platform. You can locate this ID by navigating to a table in the UI (using the catalog or search functionality) and copying the ID from the URL.
In the example below, `bq-synq-demo::nyc_taxi::financial_statement` will be the ID.
 ### Understanding the configurable parameters
You can see all the configurable parameters in the [Available YAML Fields](https://github.com/getsynq/synq-monitors?tab=readme-ov-file#available-yaml-fields) in the readme.
For more examples of configuring individual monitors, see our [Examples](https://github.com/getsynq/synq-monitors/tree/main/examples) repo.
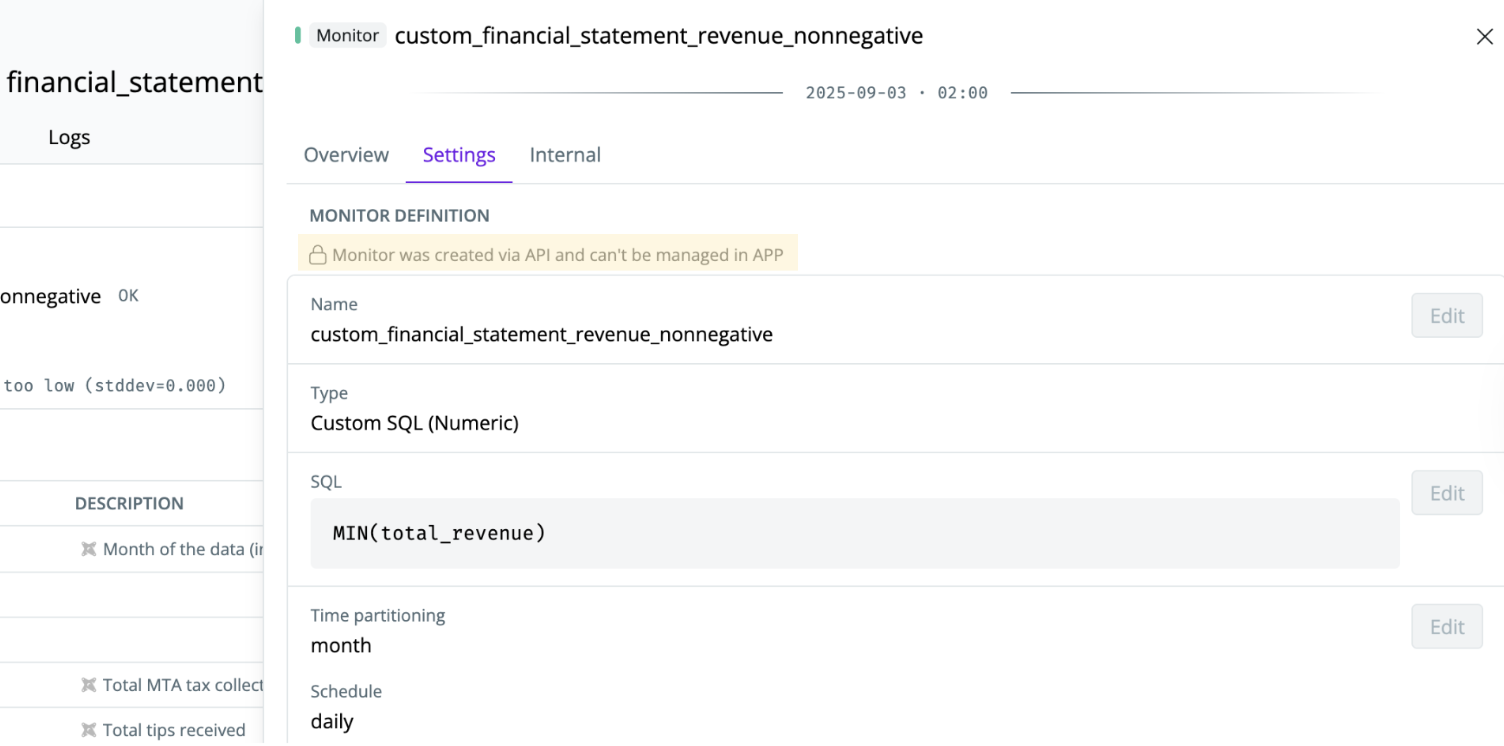
## Verifying monitors in the UI
If you navigate to the `Settings` menu for a monitor, you can verify that it's created by code by seeing the `Monitor was created via API and can't be managed in APP` label.
### Understanding the configurable parameters
You can see all the configurable parameters in the [Available YAML Fields](https://github.com/getsynq/synq-monitors?tab=readme-ov-file#available-yaml-fields) in the readme.
For more examples of configuring individual monitors, see our [Examples](https://github.com/getsynq/synq-monitors/tree/main/examples) repo.
## Verifying monitors in the UI
If you navigate to the `Settings` menu for a monitor, you can verify that it's created by code by seeing the `Monitor was created via API and can't be managed in APP` label.