> ## Documentation Index
> Fetch the complete documentation index at: https://docs.synq.io/llms.txt
> Use this file to discover all available pages before exploring further.
# Volume monitor
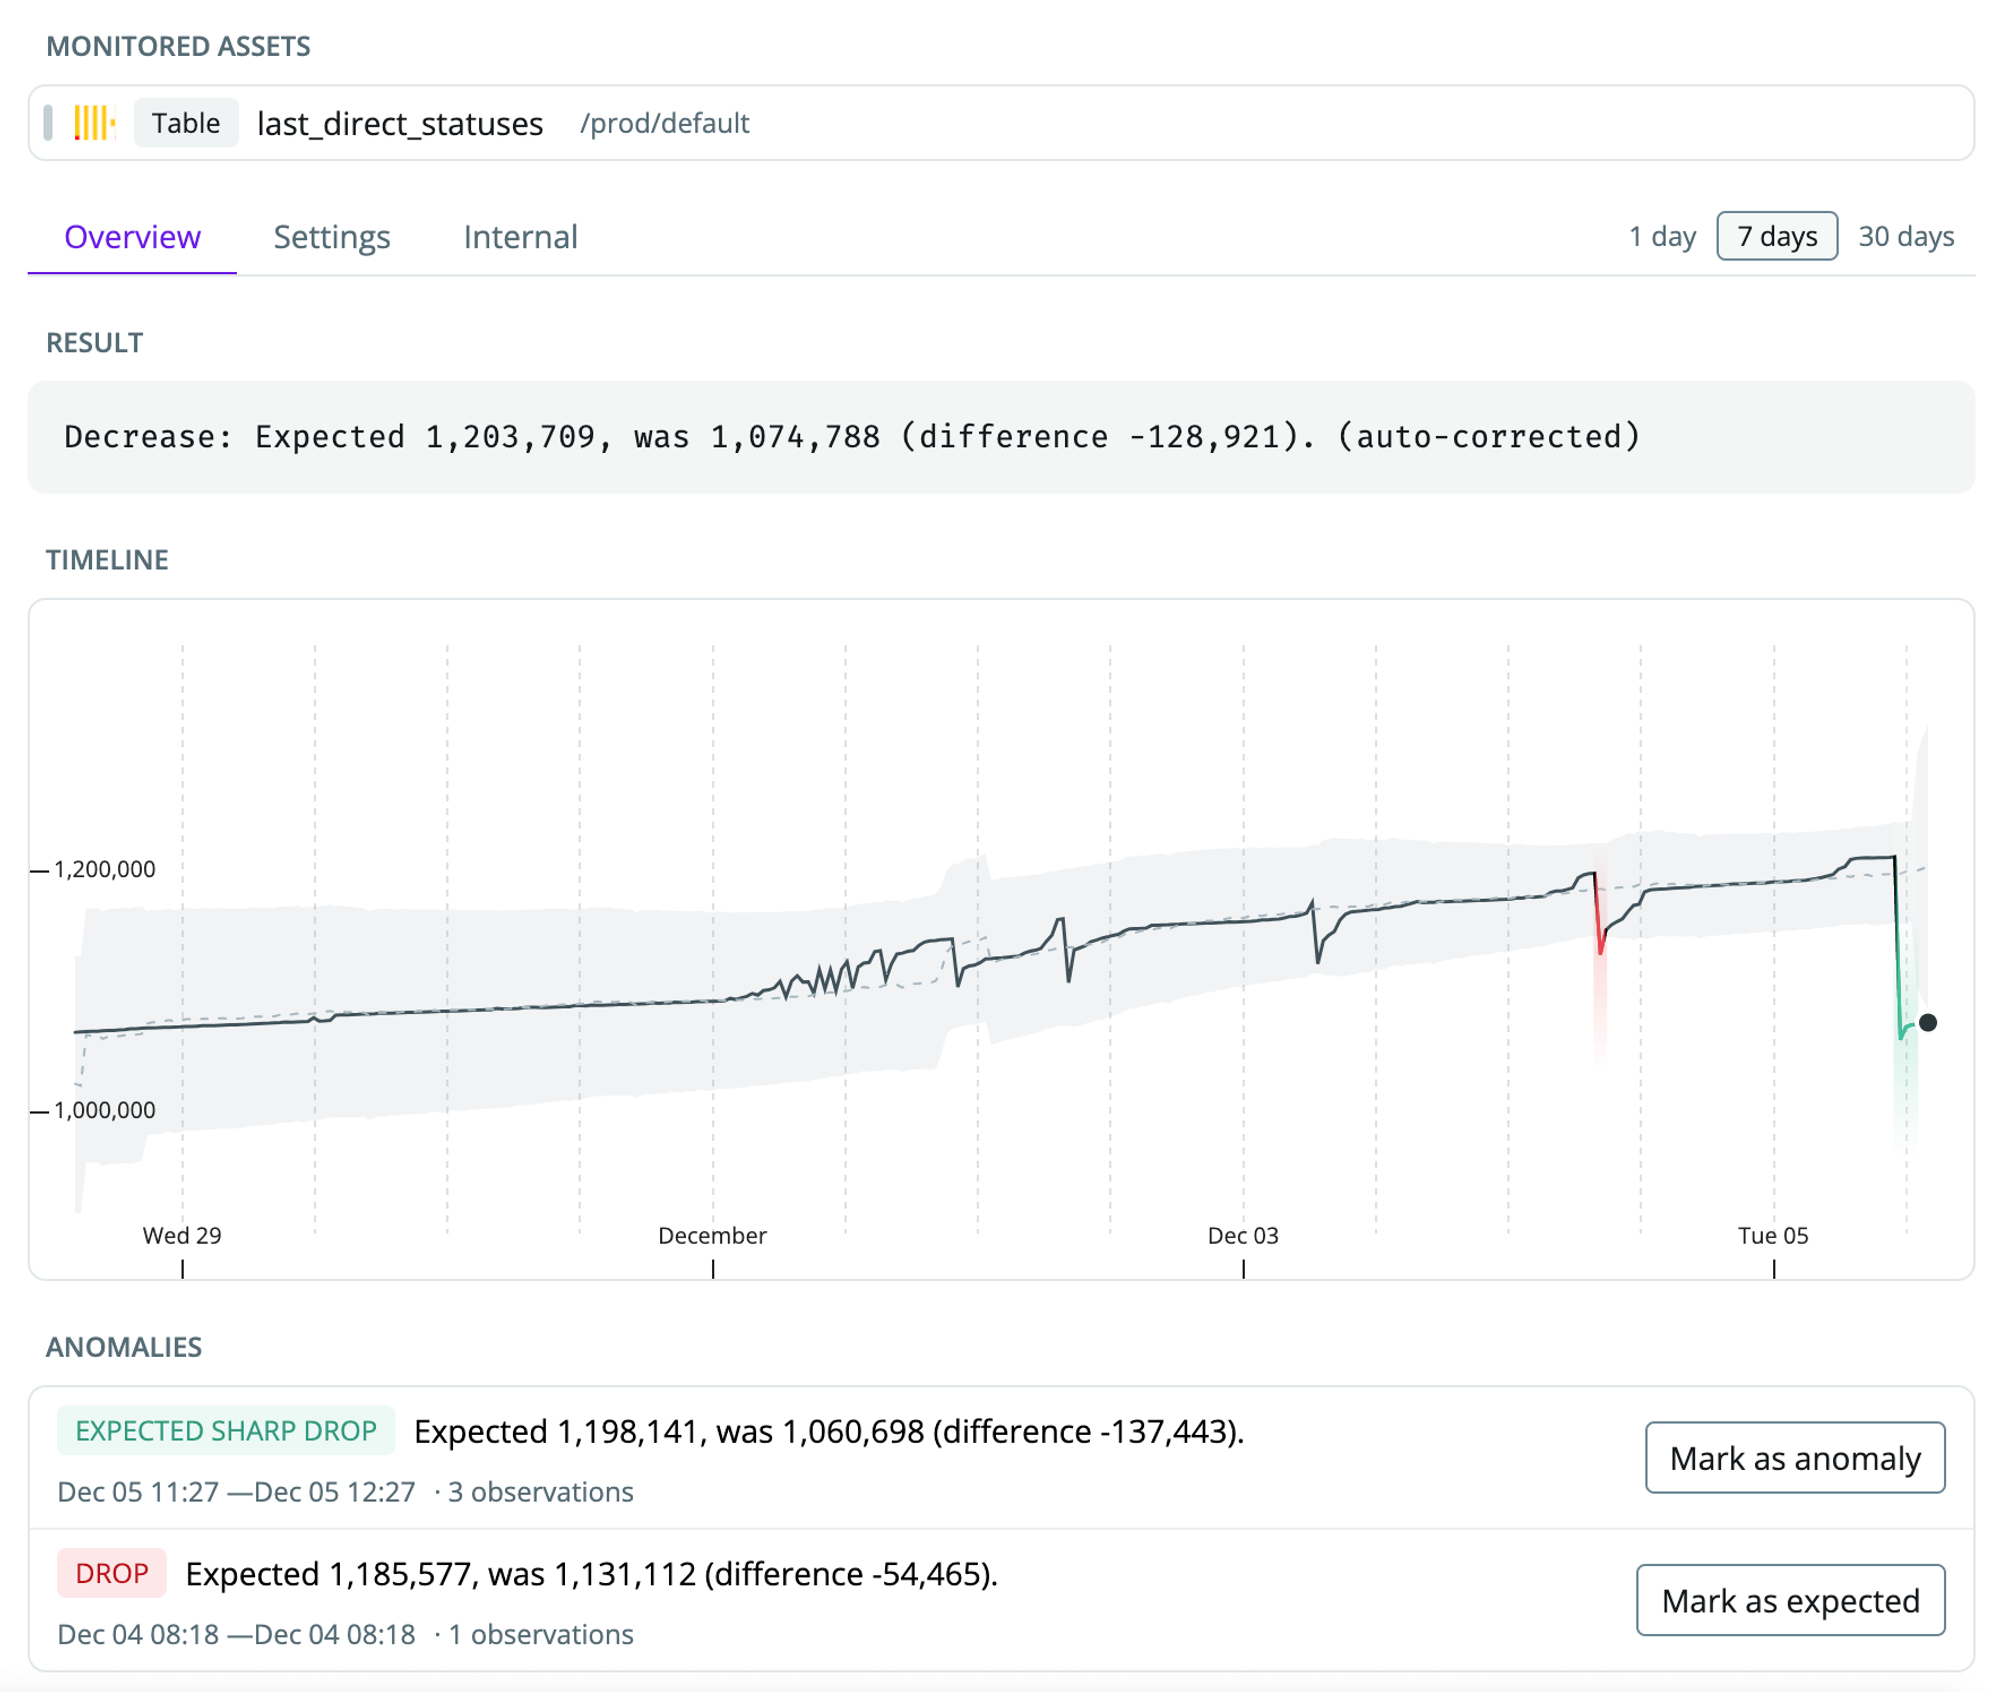
The volume monitor looks at the number of rows in a table to detect how much data is added or removed and alerts you of abnormal increases or decreases. Among others, this can help you identify.
* A sudden jump in duplicate rows due to a faulty join
* A decrease in a data source due to an upstream error
* A system failure caused no new records to be inserted
*A volume monitor highlighting a sudden drop in the row count*
 There are two different kinds of volume monitors. (1) [Default volume monitor](/monitor-types/volume-monitor#default-volume-monitor) and (2) [custom volume monitor](/monitor-types/volume-monitor#custom-volume-monitor). Read more about best practices for deploying these at [Setting up monitors](/monitors/setting-up-monitors)
## Default volume monitor
The default freshness and volume monitors have been merged into the Table stats monitor. You can see more on the [Table stats monitor page](/monitor-types/table-stats-monitor).
Default volume monitors rely on your data warehouse metadata tables, such as the `row_count` from the Snowflake table [information schema](https://docs.snowflake.com/en/sql-reference/info-schema/tables). As the monitor queries the information schema, you only incur minimal additional costs even when they are run frequently. The monitor works out of the box, which makes it easy to deploy at scale.
Unless you need custom functionality, such as grouping by a different time field, we recommend you use default volume monitors.
Default volume monitors are run every 60 minutes.
### Setting up a default volume monitor
1. Navigate to `Health` → `Manage monitors`
2. Click `Create monitor group` to define the tables you want to monitor
3. Use the browser to narrow down the tables you want to monitor
There are two different kinds of volume monitors. (1) [Default volume monitor](/monitor-types/volume-monitor#default-volume-monitor) and (2) [custom volume monitor](/monitor-types/volume-monitor#custom-volume-monitor). Read more about best practices for deploying these at [Setting up monitors](/monitors/setting-up-monitors)
## Default volume monitor
The default freshness and volume monitors have been merged into the Table stats monitor. You can see more on the [Table stats monitor page](/monitor-types/table-stats-monitor).
Default volume monitors rely on your data warehouse metadata tables, such as the `row_count` from the Snowflake table [information schema](https://docs.snowflake.com/en/sql-reference/info-schema/tables). As the monitor queries the information schema, you only incur minimal additional costs even when they are run frequently. The monitor works out of the box, which makes it easy to deploy at scale.
Unless you need custom functionality, such as grouping by a different time field, we recommend you use default volume monitors.
Default volume monitors are run every 60 minutes.
### Setting up a default volume monitor
1. Navigate to `Health` → `Manage monitors`
2. Click `Create monitor group` to define the tables you want to monitor
3. Use the browser to narrow down the tables you want to monitor
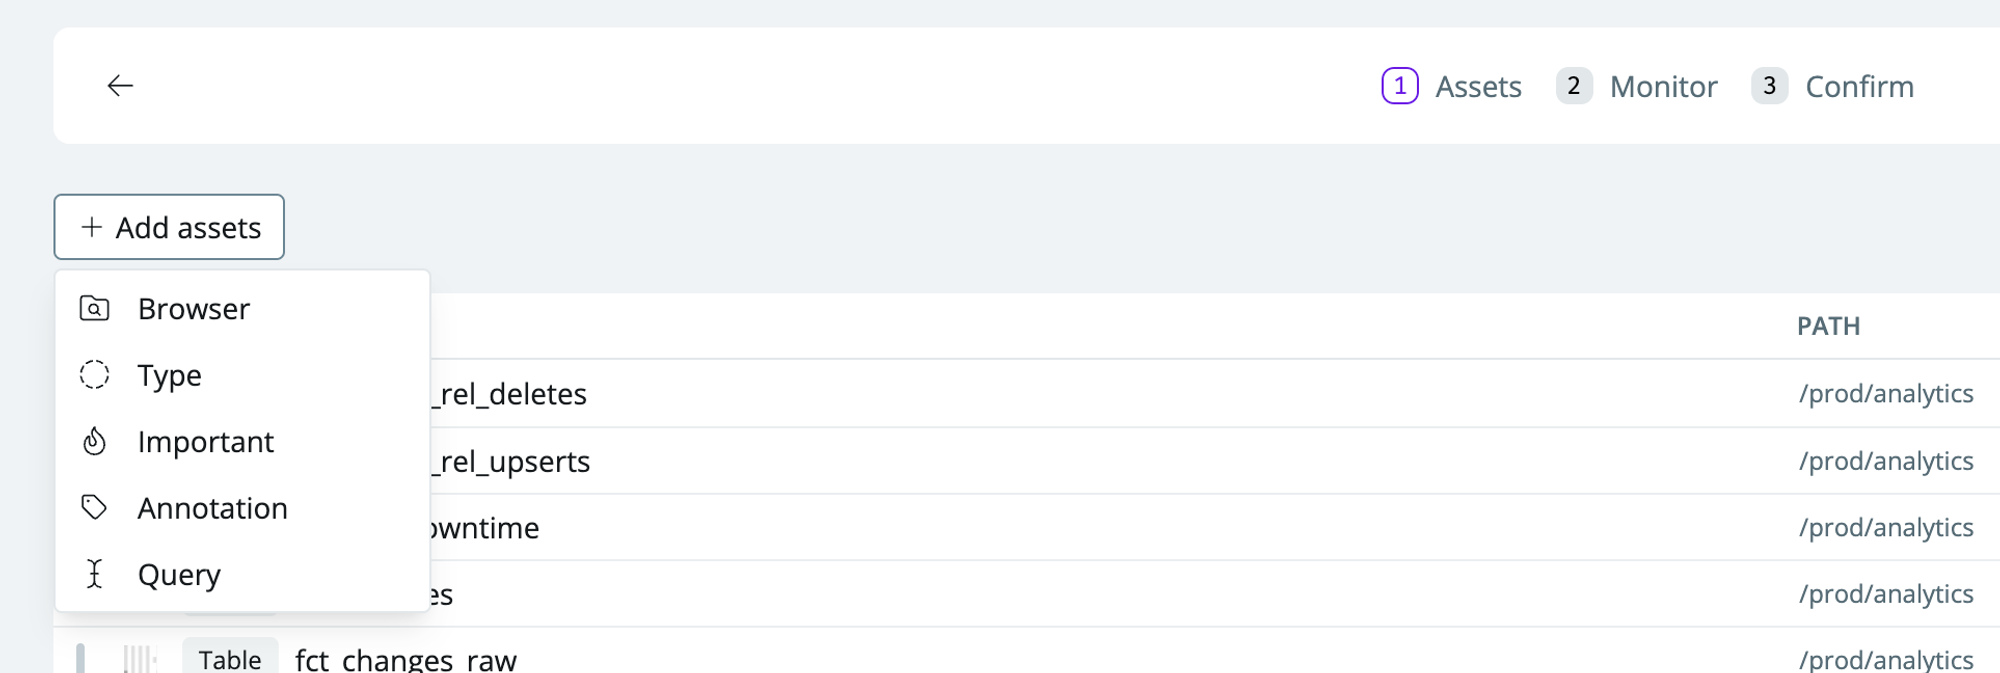 * **Browser**—select specific schemas or search for tables to monitor (your data warehouse tables and transformation models from dbt, SQLMesh, and Coalesce Transform are automatically mapped)
* **Annotation**—select assets with metadata definitions such as tags defined in your transformation layer (dbt, SQLMesh, or Coalesce Transform)
* **Important**—select assets that you’ve marked as important
* **Query**—advanced selection. E.g., search for specific keyword matches
4. Check `Volume` to set up a volume monitor group
* **Browser**—select specific schemas or search for tables to monitor (your data warehouse tables and transformation models from dbt, SQLMesh, and Coalesce Transform are automatically mapped)
* **Annotation**—select assets with metadata definitions such as tags defined in your transformation layer (dbt, SQLMesh, or Coalesce Transform)
* **Important**—select assets that you’ve marked as important
* **Query**—advanced selection. E.g., search for specific keyword matches
4. Check `Volume` to set up a volume monitor group
 5. Name the monitor (e.g., *important tables volume monitor*).
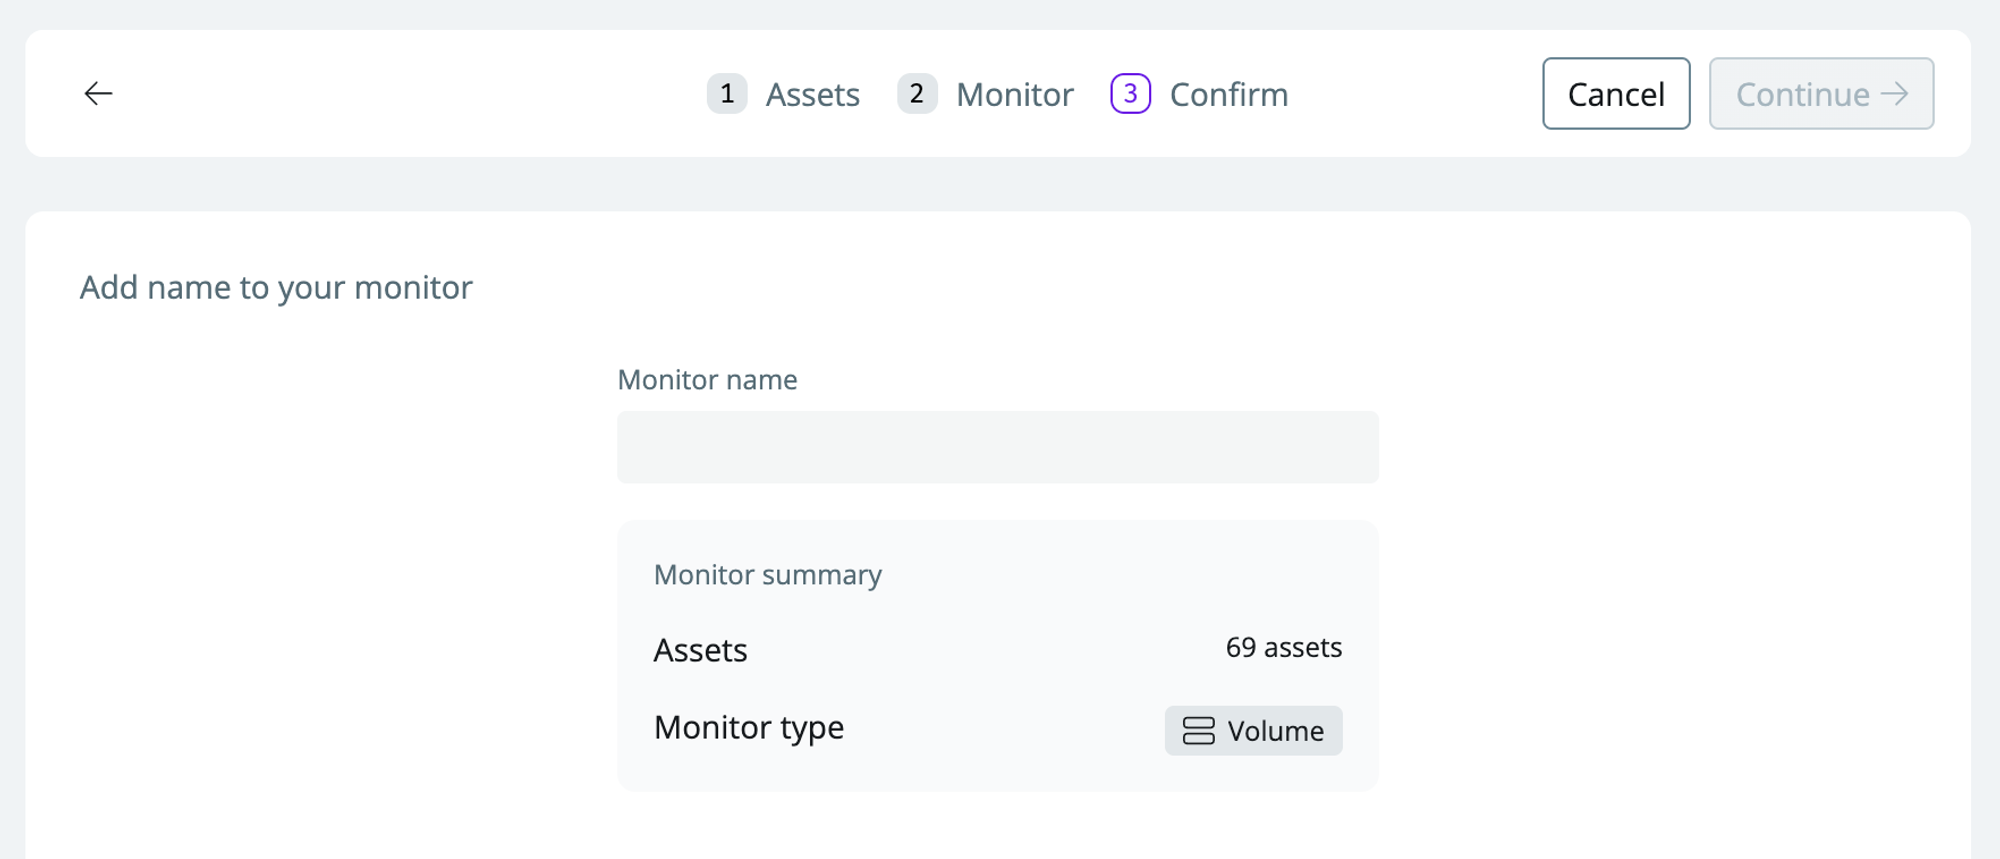 6. Click `continue` to set up the monitor
You’ll be able to see all monitors on the [Health overview page](https://app.synq.io/healthz/overview) and adjust the monitor sensitivity.
As soon as you’ve set the monitor up, it will start learning the behaviors of your data every hour. You should expect \~10 days before the monitor has built an understanding of the seasonality and patterns in your data and is confidently able to detect anomalies
## Custom volume monitor
Unlike the default volume monitor, the custom volume monitor queries your raw data. This gives you more configuration options, such as specifying a time dimension or automatically grouping by a segment. However, it also means that each monitor must be configured individually and that you may incur additional costs from running it.
Custom volume monitors are designed as *growth monitors* meaning that they look at the growth or shrink in the data relative to the previous period as specified by the time partition. This makes them suitable for detecting subtle changes or if no new data starts arriving, even for a short period.
### Setting up a custom volume monitor
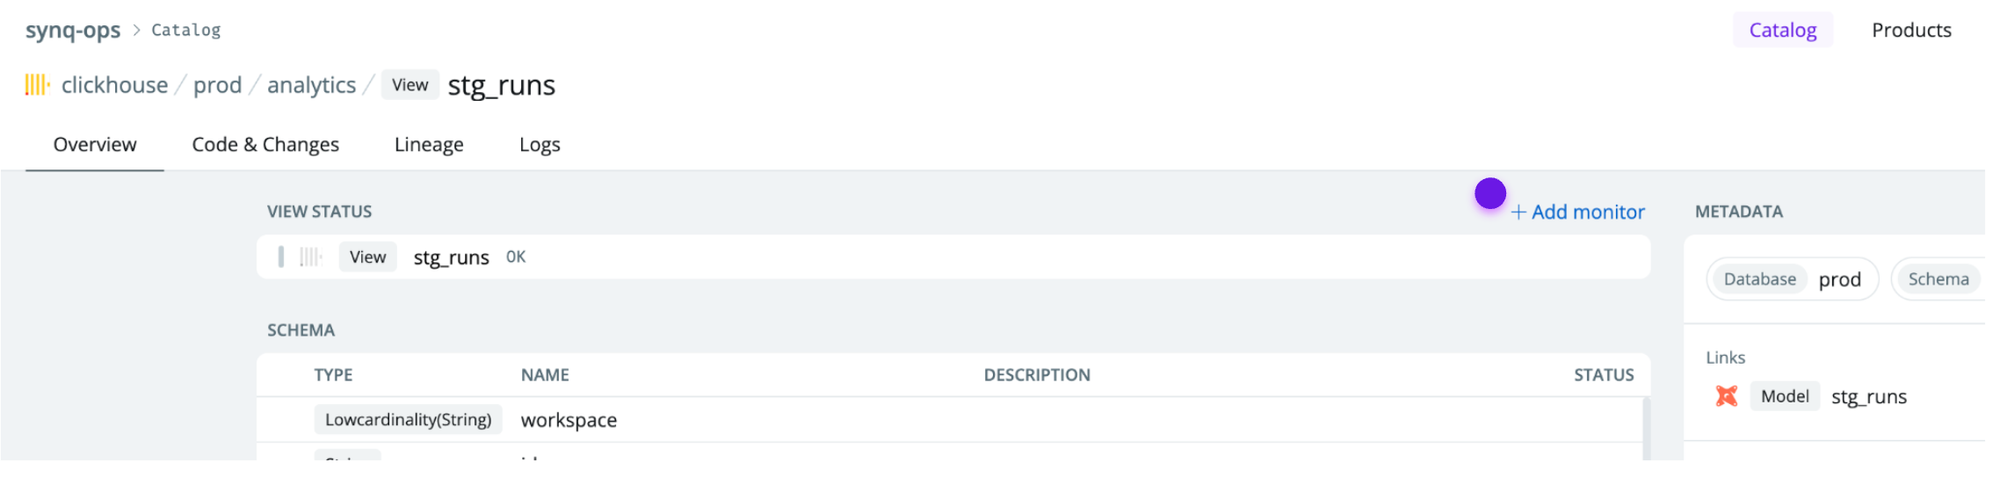
1. Navigate to the table or transformation model (dbt model, SQLMesh model, Coalesce node) where you want to set up the monitor and click `Add Monitor`
6. Click `continue` to set up the monitor
You’ll be able to see all monitors on the [Health overview page](https://app.synq.io/healthz/overview) and adjust the monitor sensitivity.
As soon as you’ve set the monitor up, it will start learning the behaviors of your data every hour. You should expect \~10 days before the monitor has built an understanding of the seasonality and patterns in your data and is confidently able to detect anomalies
## Custom volume monitor
Unlike the default volume monitor, the custom volume monitor queries your raw data. This gives you more configuration options, such as specifying a time dimension or automatically grouping by a segment. However, it also means that each monitor must be configured individually and that you may incur additional costs from running it.
Custom volume monitors are designed as *growth monitors* meaning that they look at the growth or shrink in the data relative to the previous period as specified by the time partition. This makes them suitable for detecting subtle changes or if no new data starts arriving, even for a short period.
### Setting up a custom volume monitor
1. Navigate to the table or transformation model (dbt model, SQLMesh model, Coalesce node) where you want to set up the monitor and click `Add Monitor`
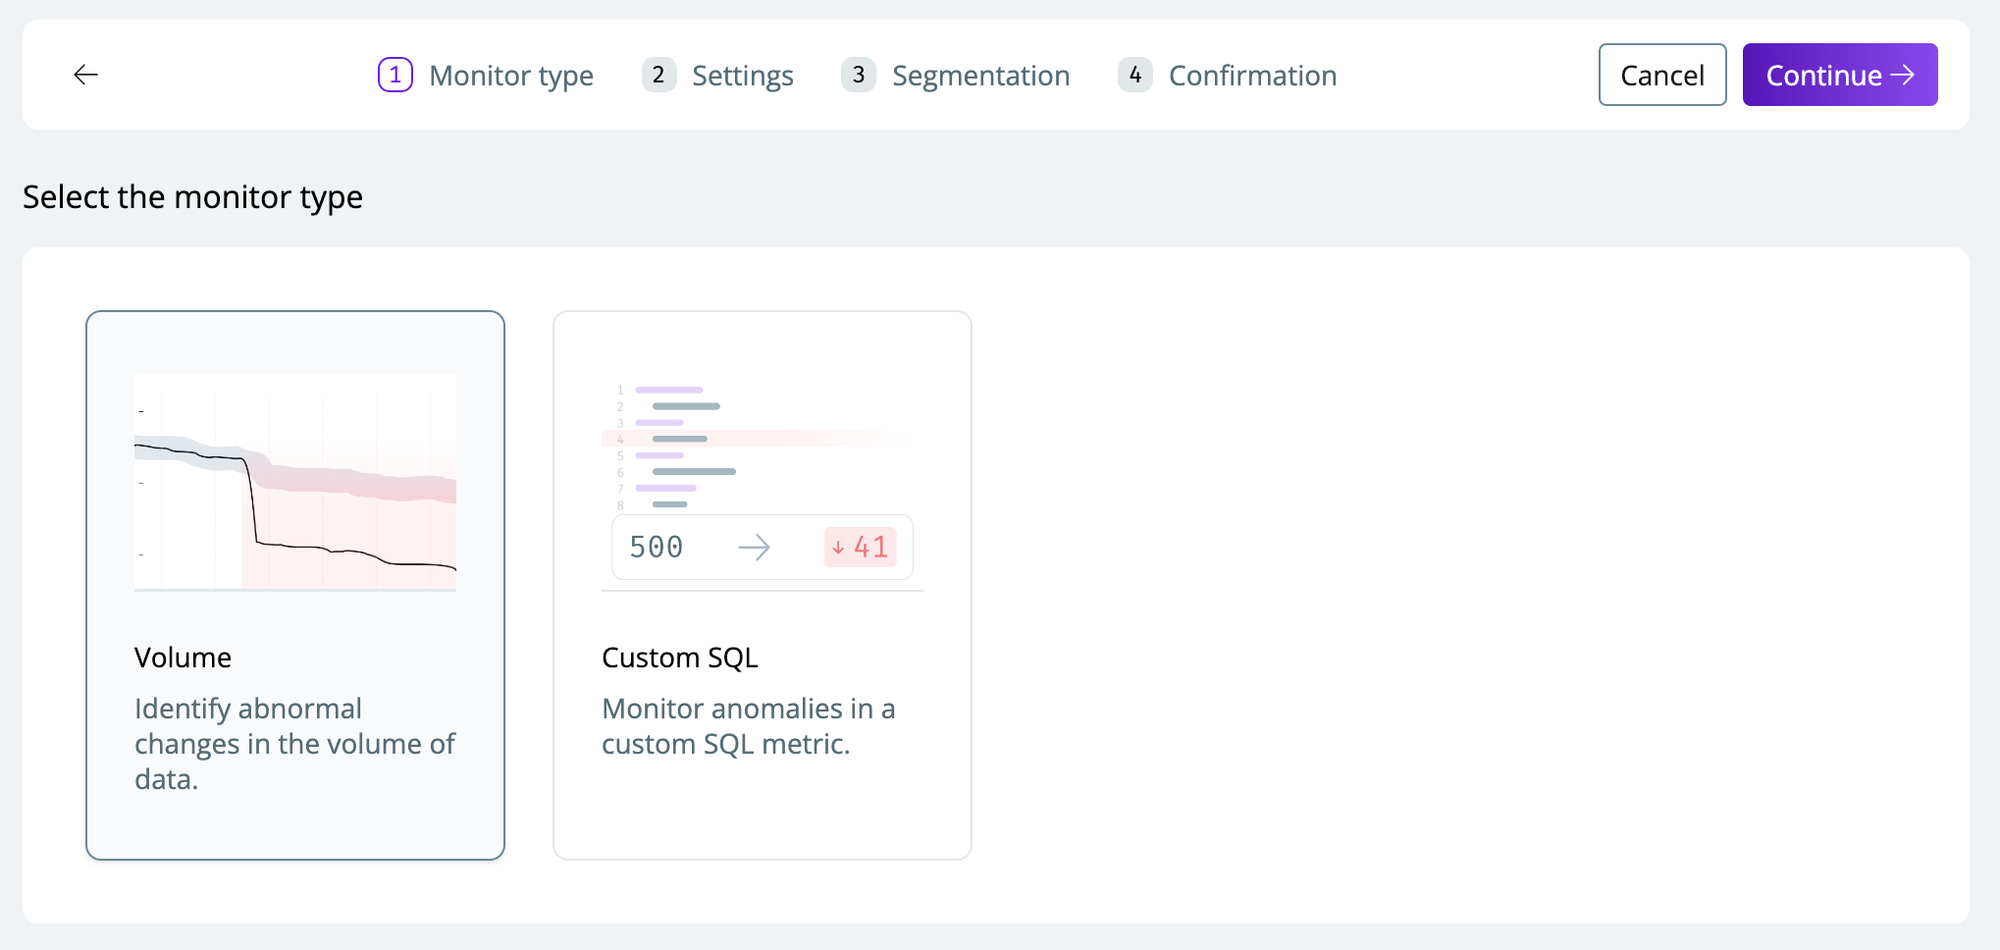
 2. Select `Volume` to start creating a custom volume monitor
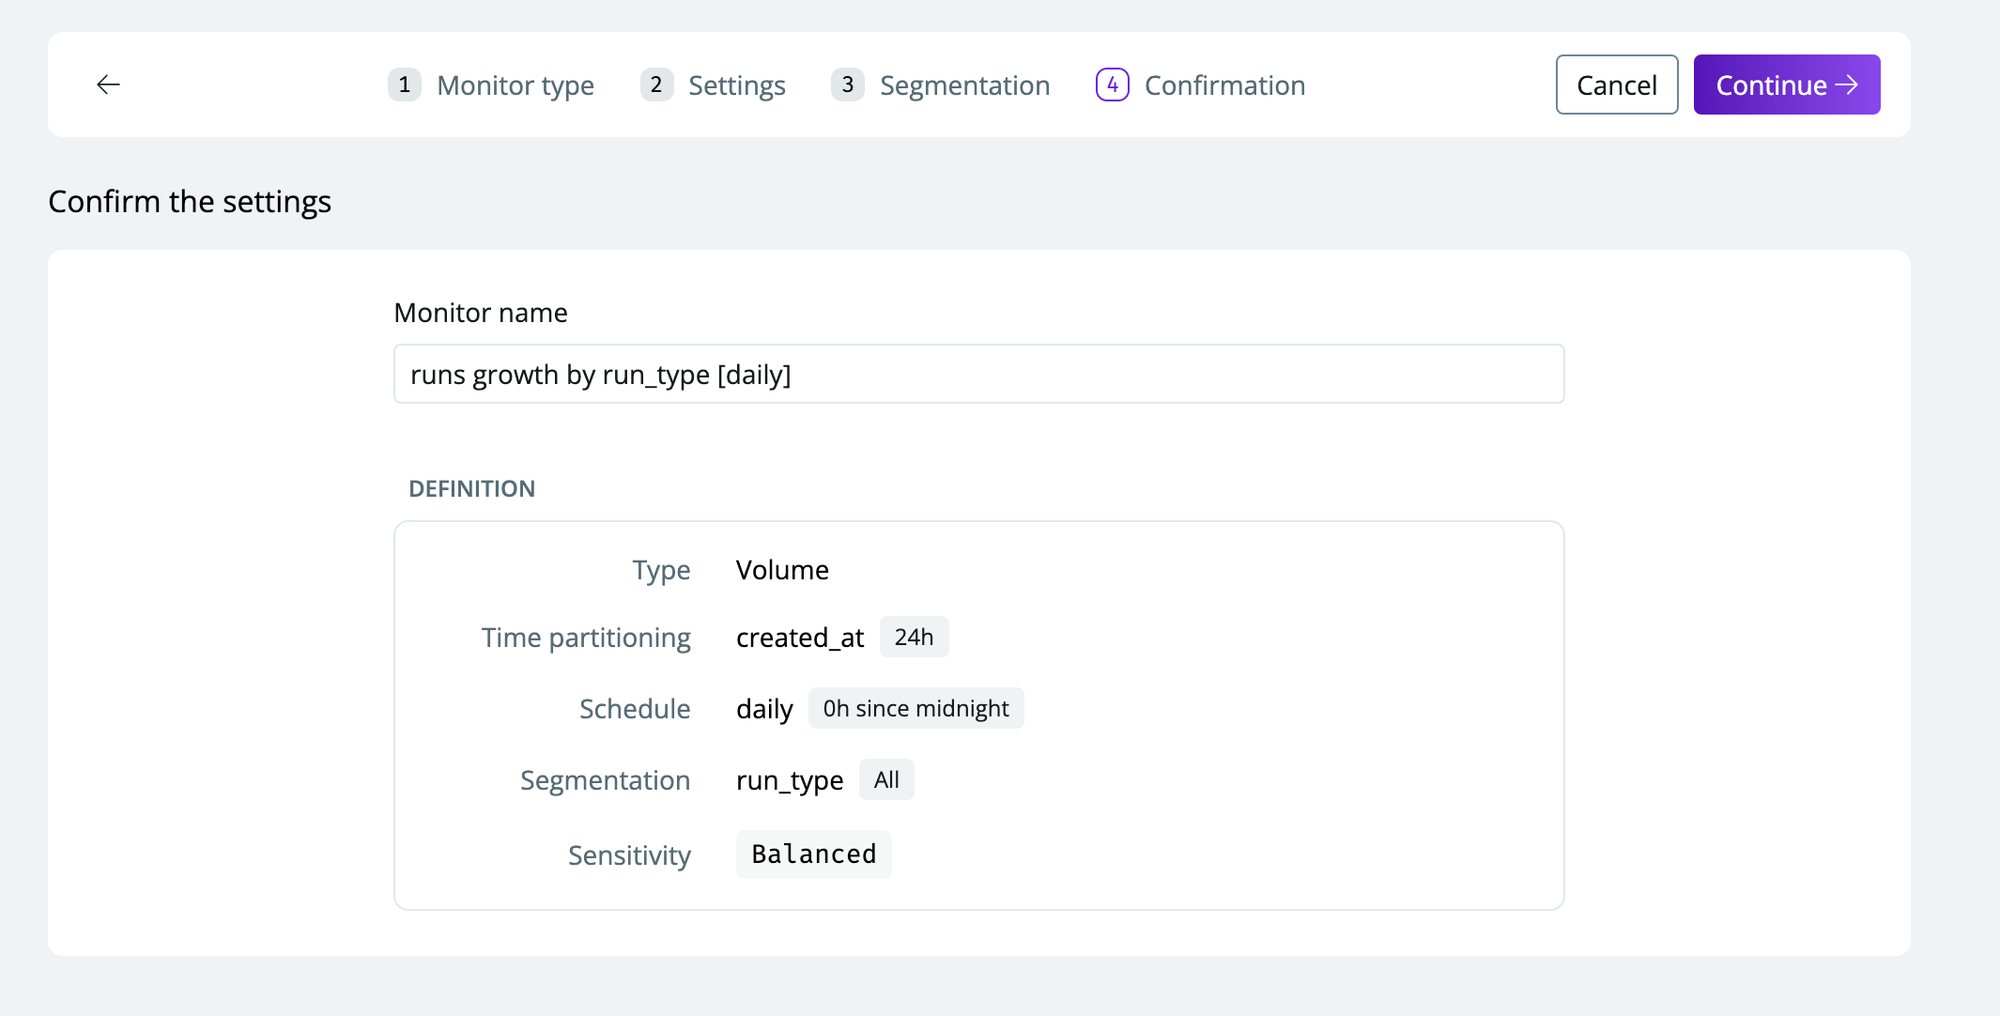
 3. Configure the monitor with the relevant settings
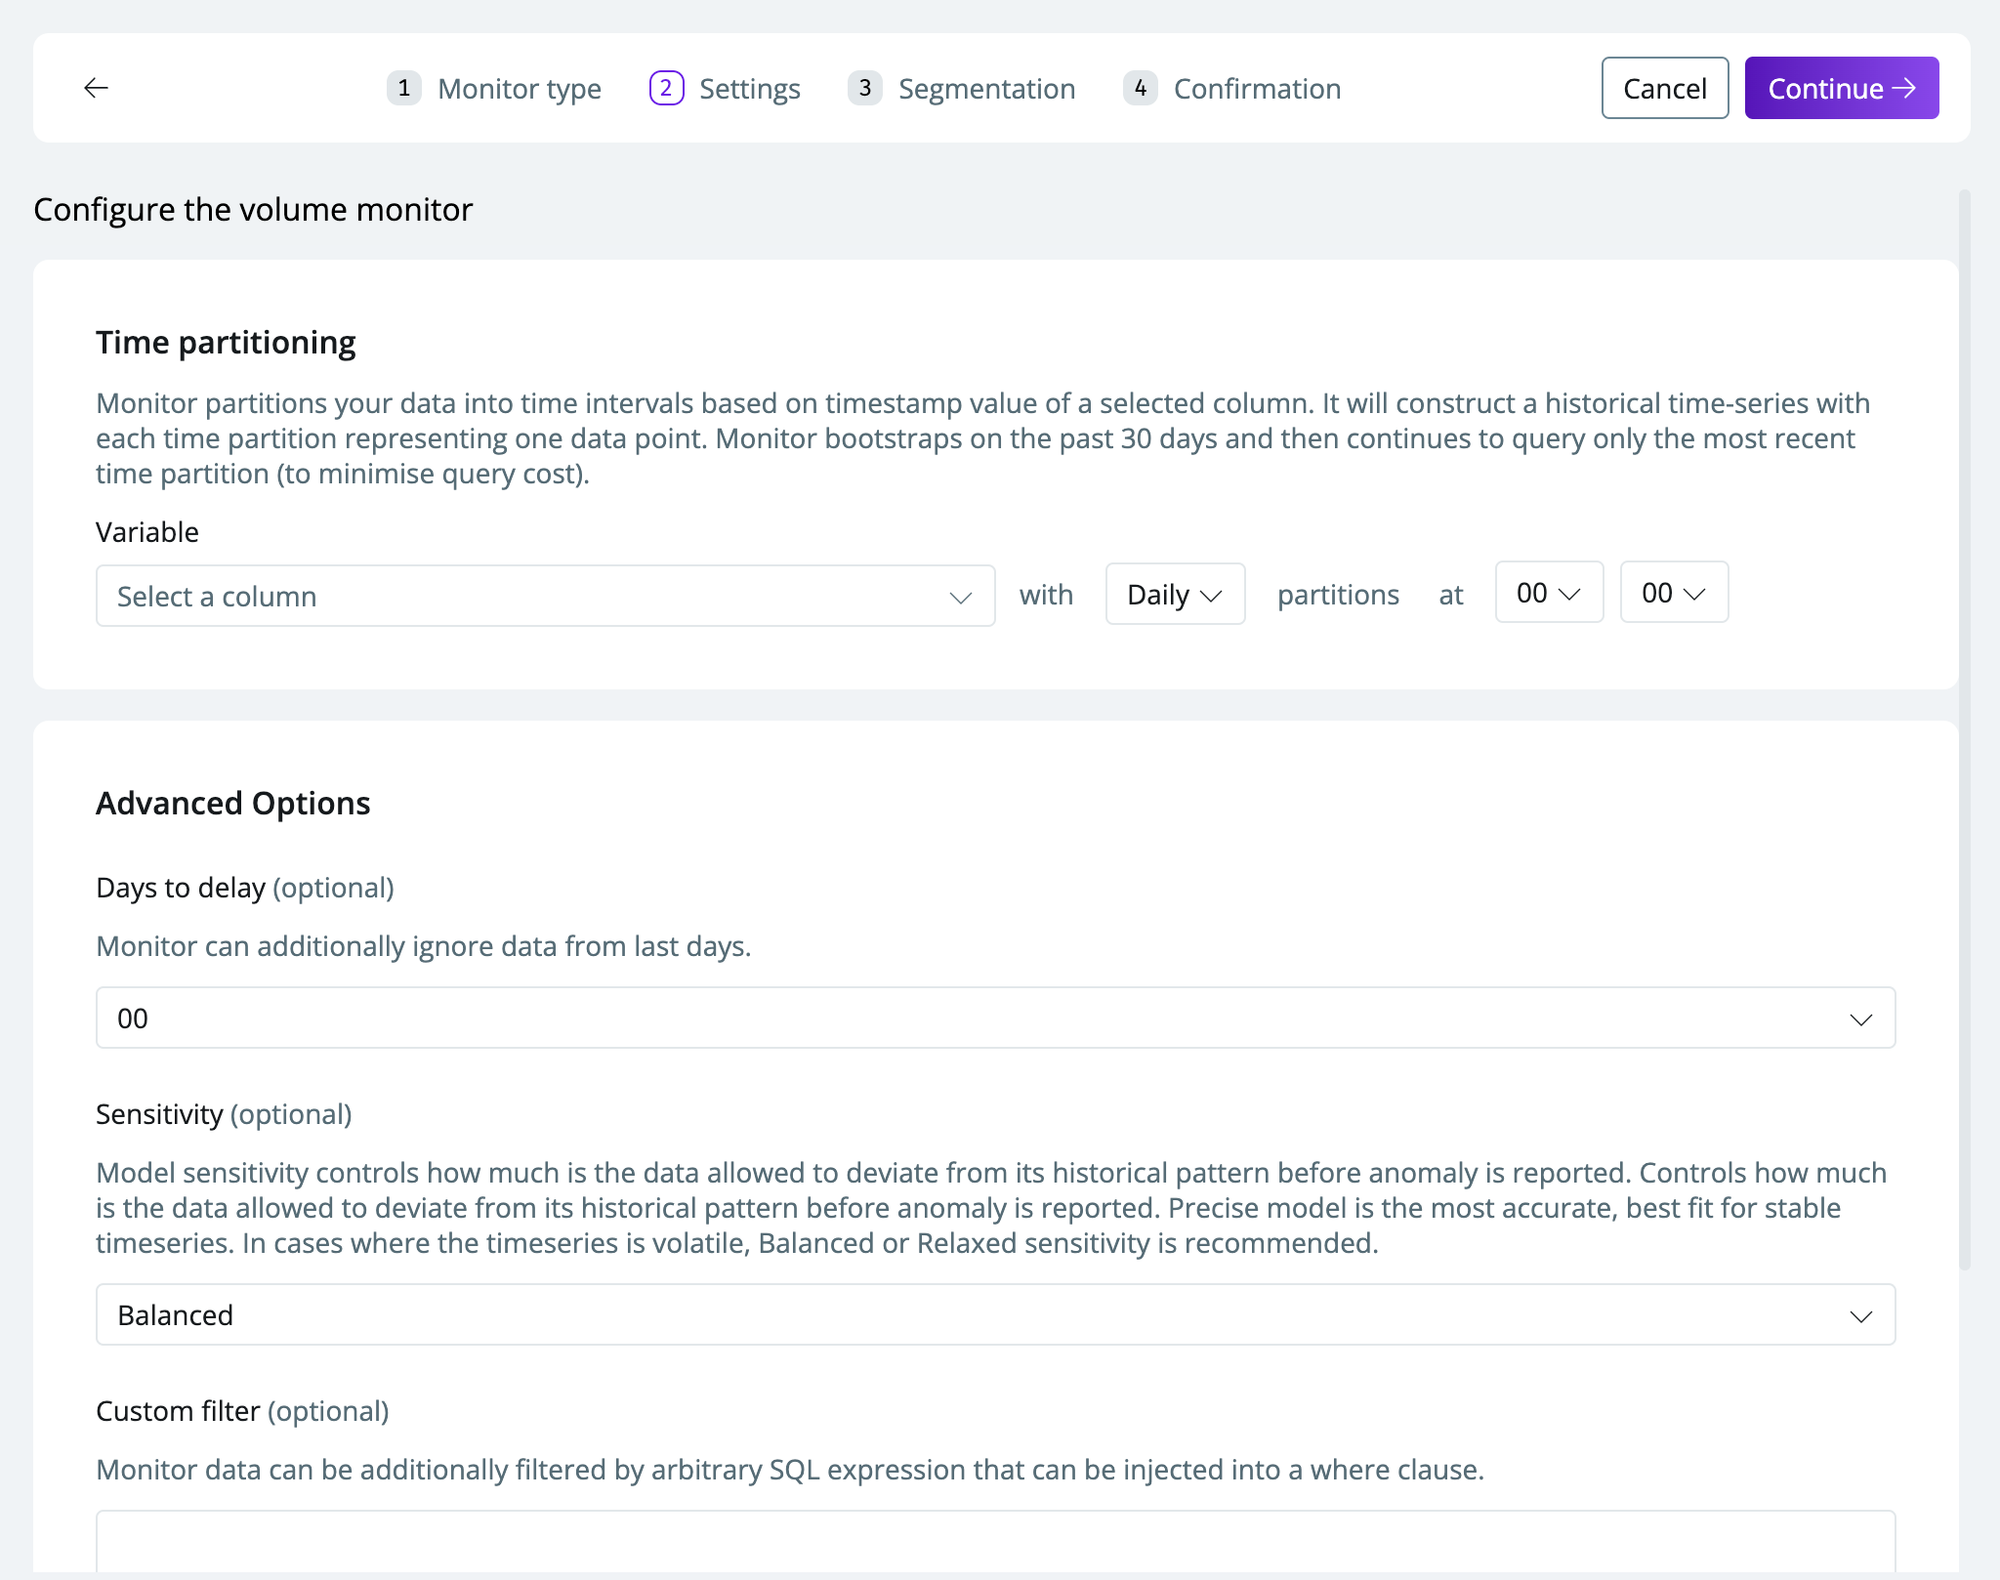 * **Time partition**—the time partition you want your data segmented by (e.g., *creation\_date*)
* **Days to delay**—days to ignore if you have a delay in when you expect fresh data
* **Sensitivity**—see [Configuring model sensitivity](/monitors/monitor-sensitivity)
* **Custom filter**—specify custom SQL to filter by
4. Select a `variable` to segment by (*optional*). This will create multiple time series for each segment you select to include
* If you only want to create a monitor for specific segments, toggle `Selected values` and select the desired values
* If you select `All values`, new values are automatically added.
* **Time partition**—the time partition you want your data segmented by (e.g., *creation\_date*)
* **Days to delay**—days to ignore if you have a delay in when you expect fresh data
* **Sensitivity**—see [Configuring model sensitivity](/monitors/monitor-sensitivity)
* **Custom filter**—specify custom SQL to filter by
4. Select a `variable` to segment by (*optional*). This will create multiple time series for each segment you select to include
* If you only want to create a monitor for specific segments, toggle `Selected values` and select the desired values
* If you select `All values`, new values are automatically added.
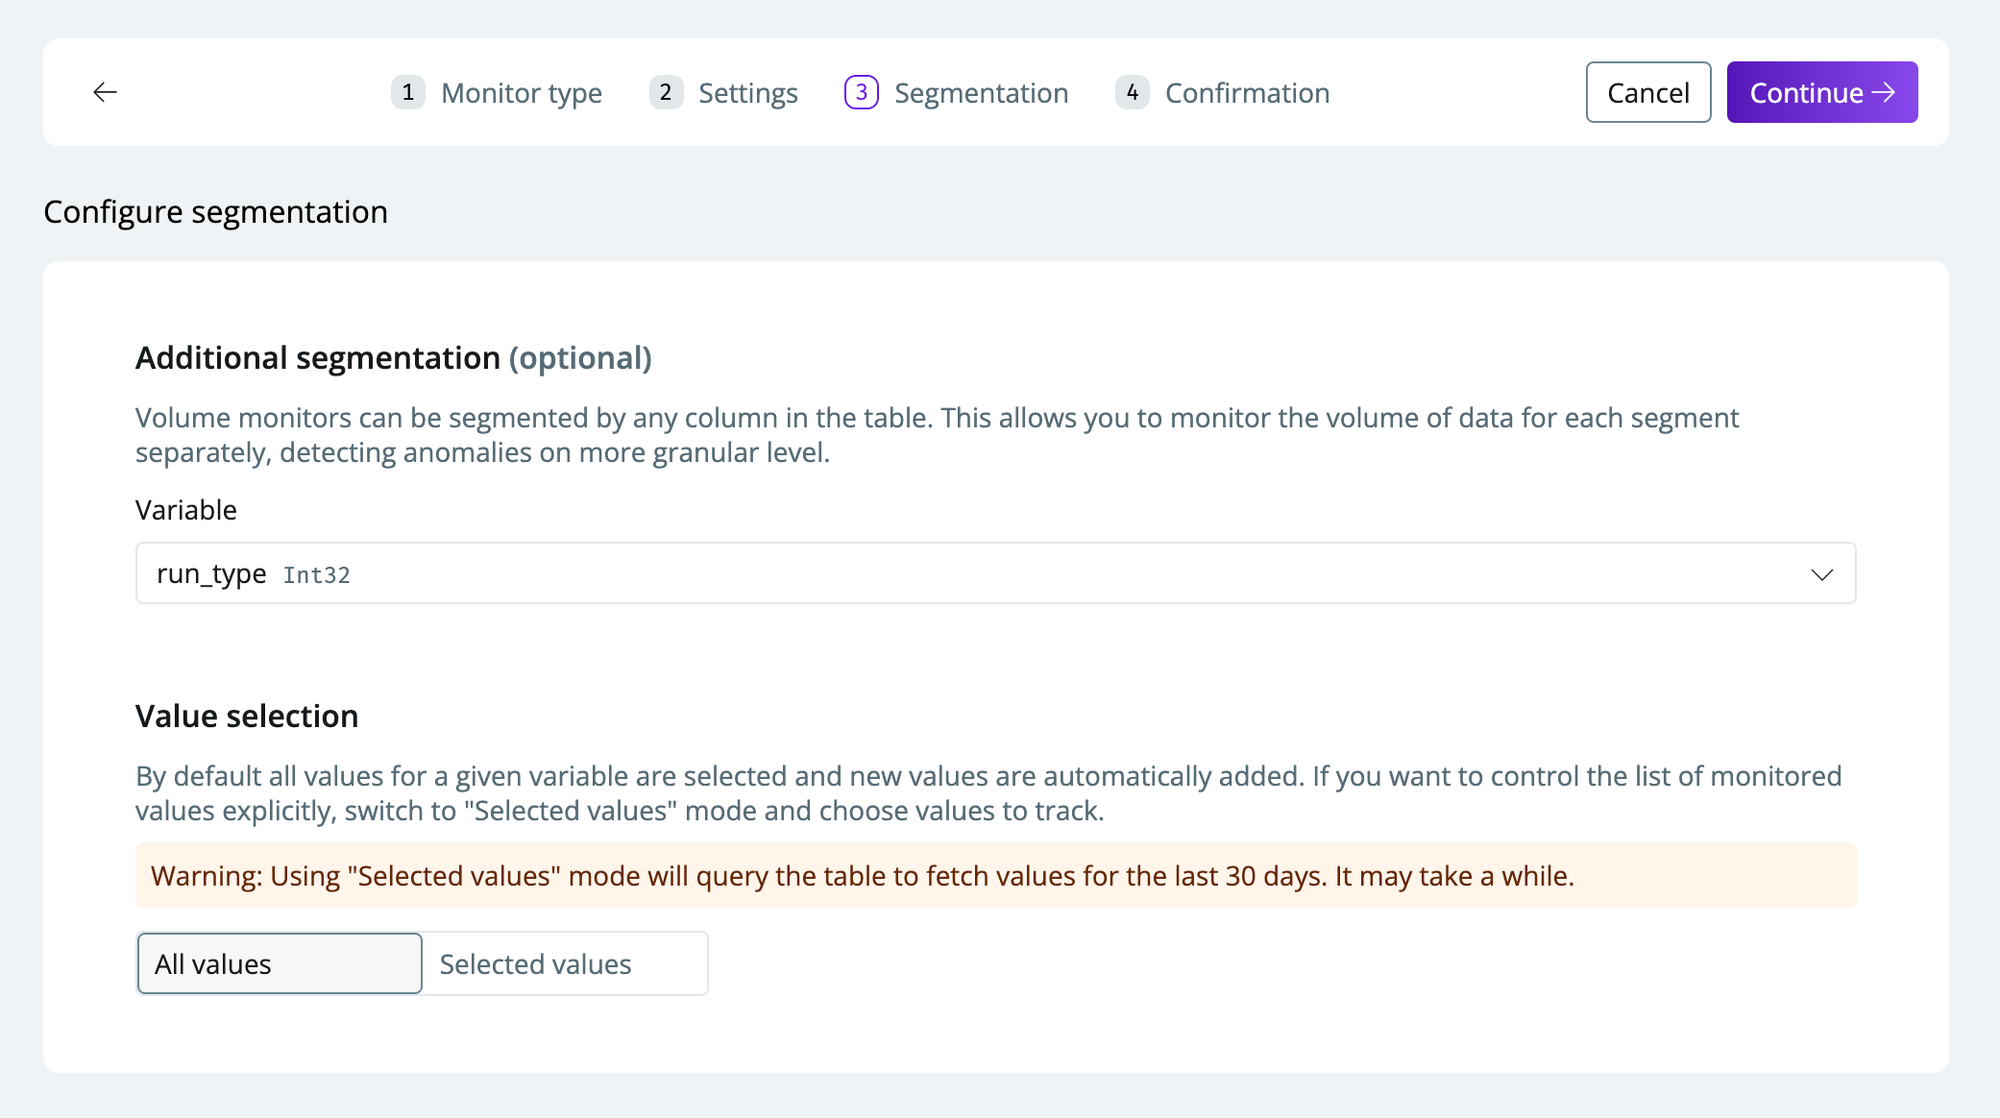 Be cautious of including segments with only a few data points, as the model may not be able to confidently learn a reliable confidence interval for these segments, which can lead to many false/positive alerts
5. Click `continue` to set up the monitor with the specified configurations
Be cautious of including segments with only a few data points, as the model may not be able to confidently learn a reliable confidence interval for these segments, which can lead to many false/positive alerts
5. Click `continue` to set up the monitor with the specified configurations
 The monitor will appear shortly and can be found directly under the table you created it for and on the [Health page](https://app.synq.io/healthz/overview)
Custom monitors partition your data into time intervals based on the timestamp value of a selected column. It will construct a historical time series, each time partition representing one data point. Monitor bootstraps on the past 30 days and then continue to query only the most recent time partition (to minimize query cost). This means that the monitor will be able to detect anomalies right after you’ve set it up
**Resetting a monitor**
If you want to rerun predictions for the past 30 days in case you made historical updates on the data, you can go to the monitor, click Settings, and press Reset monitor. This step is not reversible to only proceed if you’re certain you want to reset the monitor.
The monitor will appear shortly and can be found directly under the table you created it for and on the [Health page](https://app.synq.io/healthz/overview)
Custom monitors partition your data into time intervals based on the timestamp value of a selected column. It will construct a historical time series, each time partition representing one data point. Monitor bootstraps on the past 30 days and then continue to query only the most recent time partition (to minimize query cost). This means that the monitor will be able to detect anomalies right after you’ve set it up
**Resetting a monitor**
If you want to rerun predictions for the past 30 days in case you made historical updates on the data, you can go to the monitor, click Settings, and press Reset monitor. This step is not reversible to only proceed if you’re certain you want to reset the monitor.