> ## Documentation Index
> Fetch the complete documentation index at: https://docs.synq.io/llms.txt
> Use this file to discover all available pages before exploring further.
# Lineage overview
Our lineage is built to be performant and work out of the box. This means you’ll automatically get column-level lineage from BigQuery, Snowflake, Redshift, and ClickHouse to Looker and Tableau with the ability to explore thousands of assets with sub-second latency. The lineage is helpful for core workflows such as
* Understand the downstream impact of an issue across your transformation layers (dbt, SQLMesh, Coalesce Transform) and BI tools to decide the urgency at which you resolve it.
* Understand the downstream implications of making a change to a column upstream.
* Debugging a data issue to find upstream dependencies.
The lineage is automatically extracted from your data warehouse and BI tool several times daily, ensuring you always have an up-to-date view.
### Understanding the downstream impact of an issue
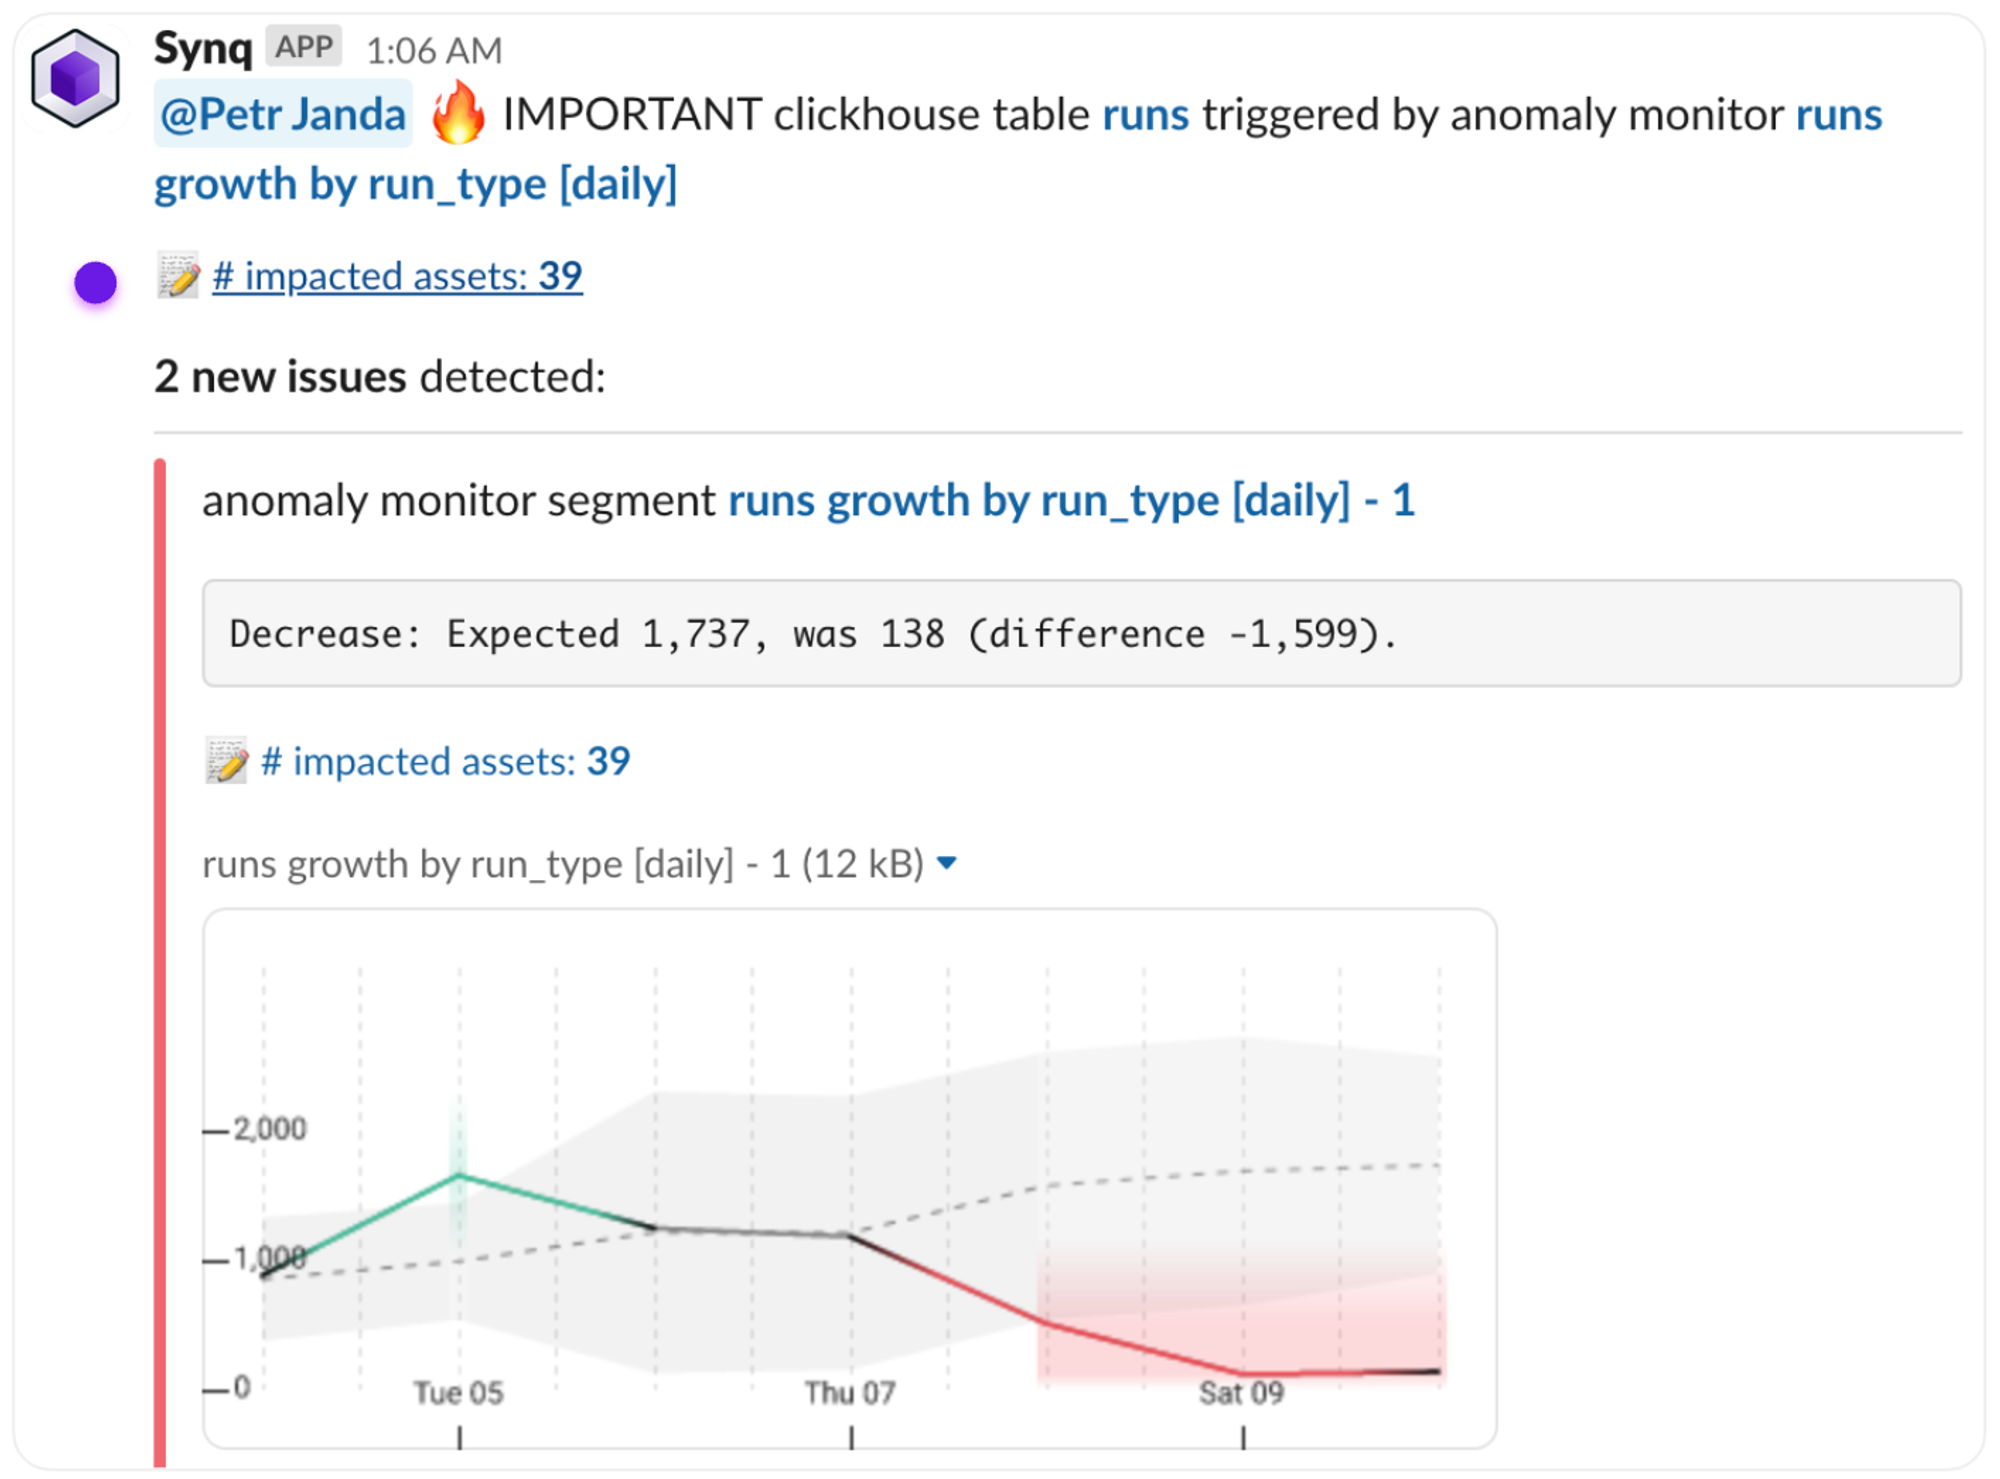
1. Alerts show the number of impacted assets. Clicking on the impacted assets brings you to the lineage view with these assets pre-filtered
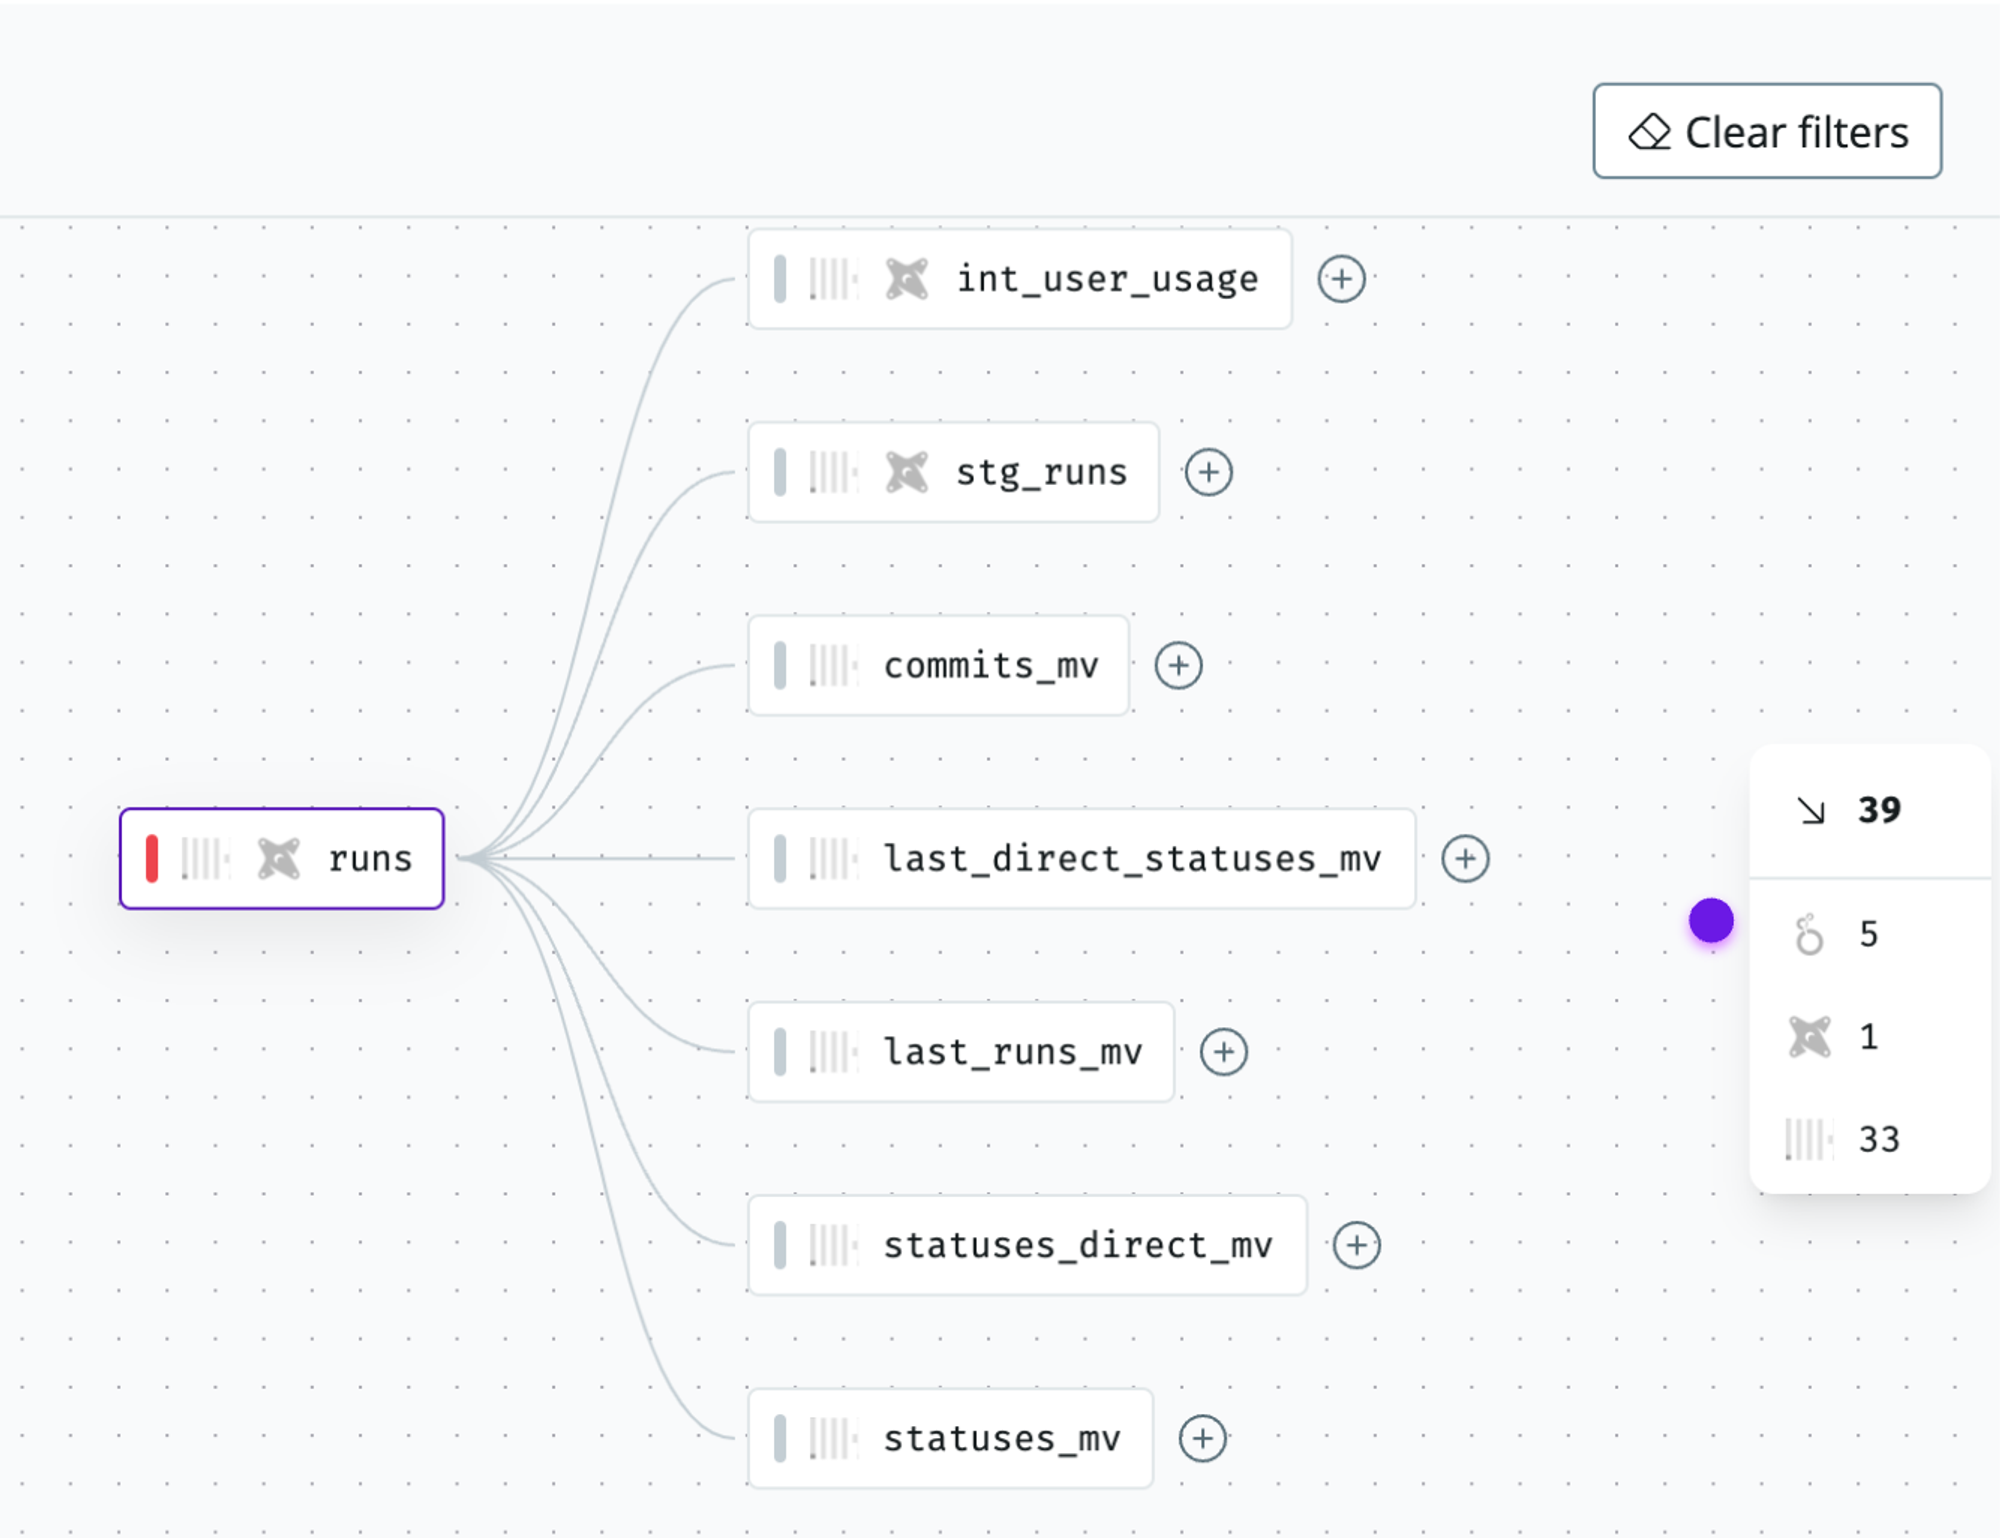
 2. Use the sidebar to quickly filter down to specific assets downstream, such as a Looker dashboard.
 ### Assessing the impact of making a change
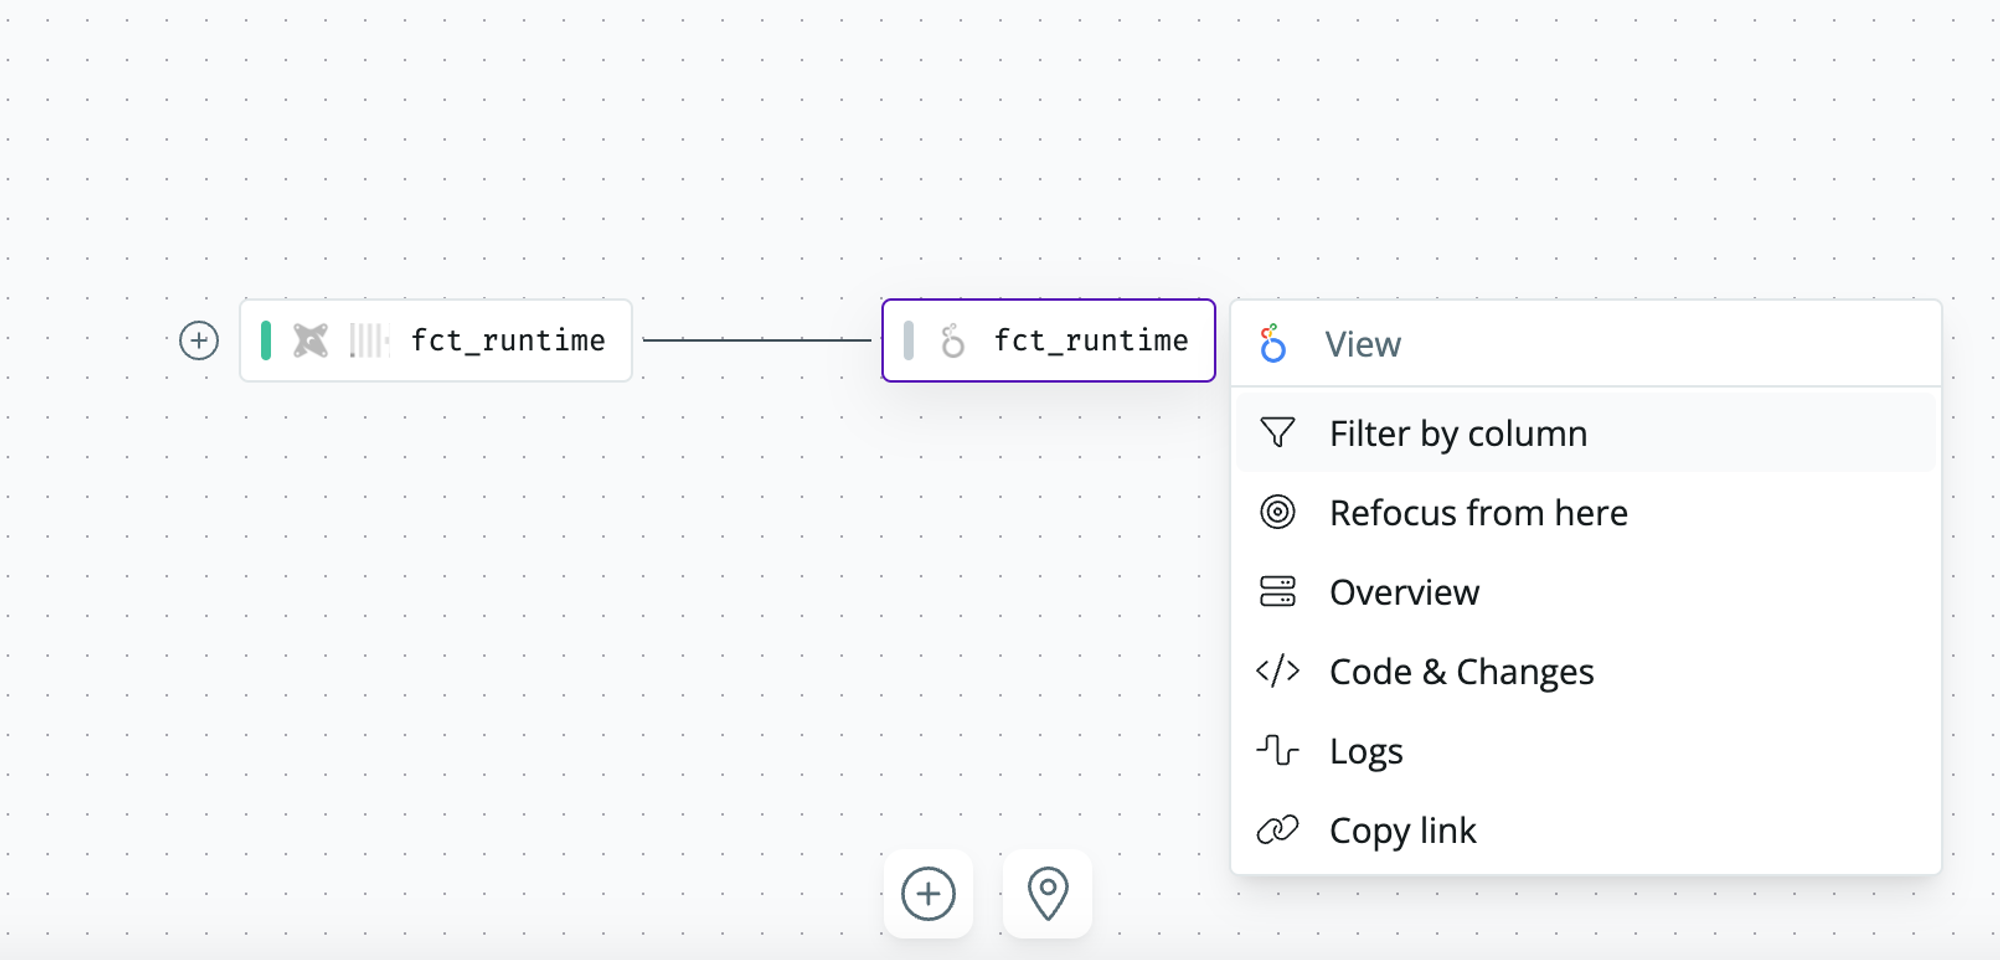
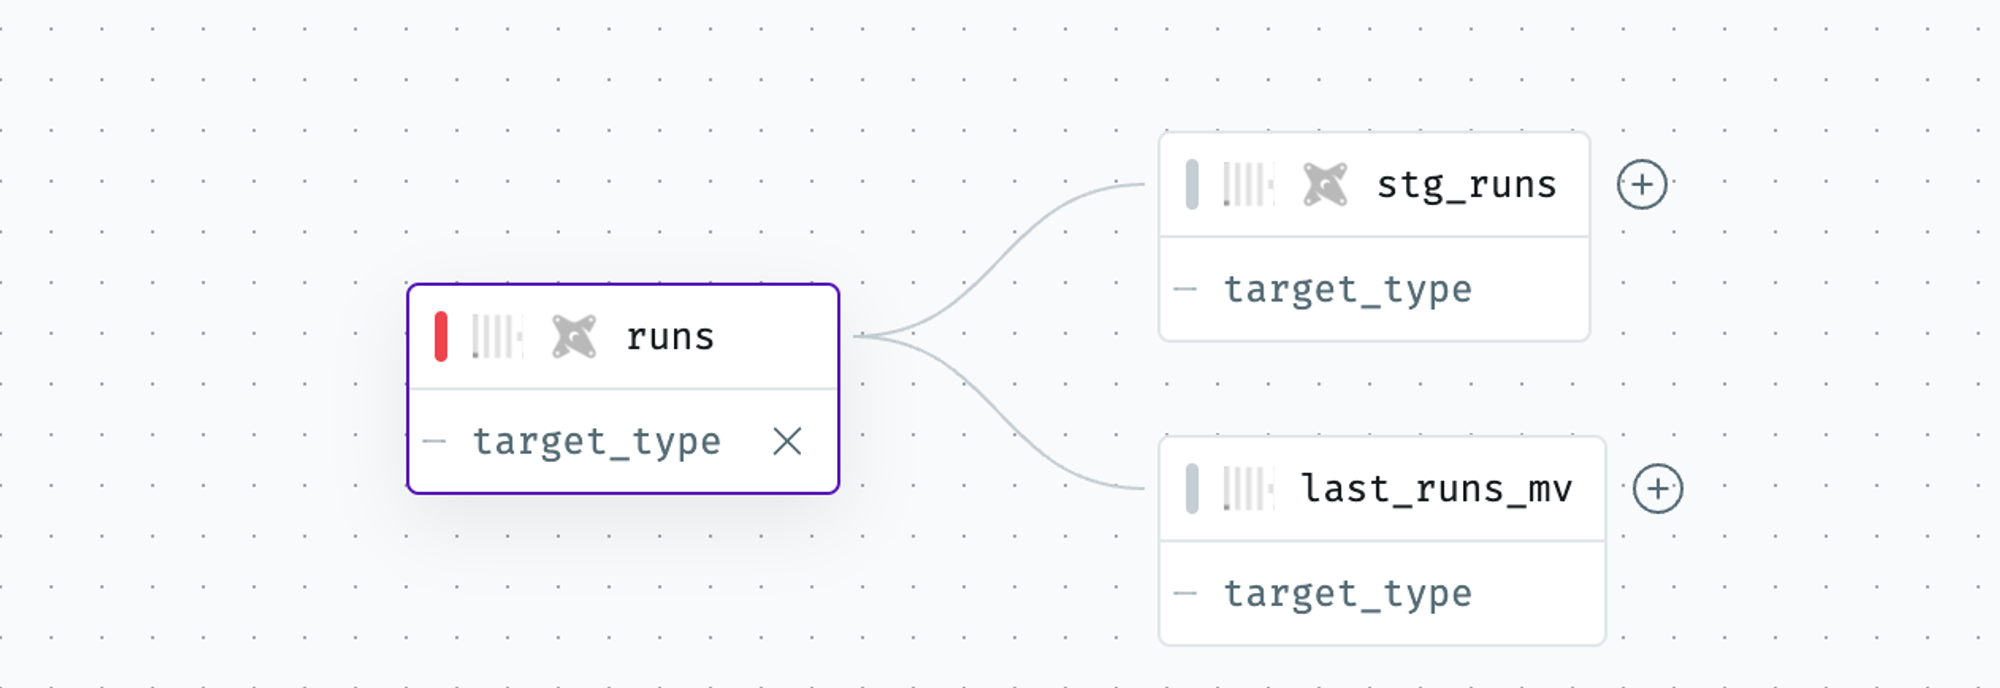
1. Navigate to the lineage for the table you’re about to change and click on the table name in the lineage to toggle `Filter by column`
### Assessing the impact of making a change
1. Navigate to the lineage for the table you’re about to change and click on the table name in the lineage to toggle `Filter by column`
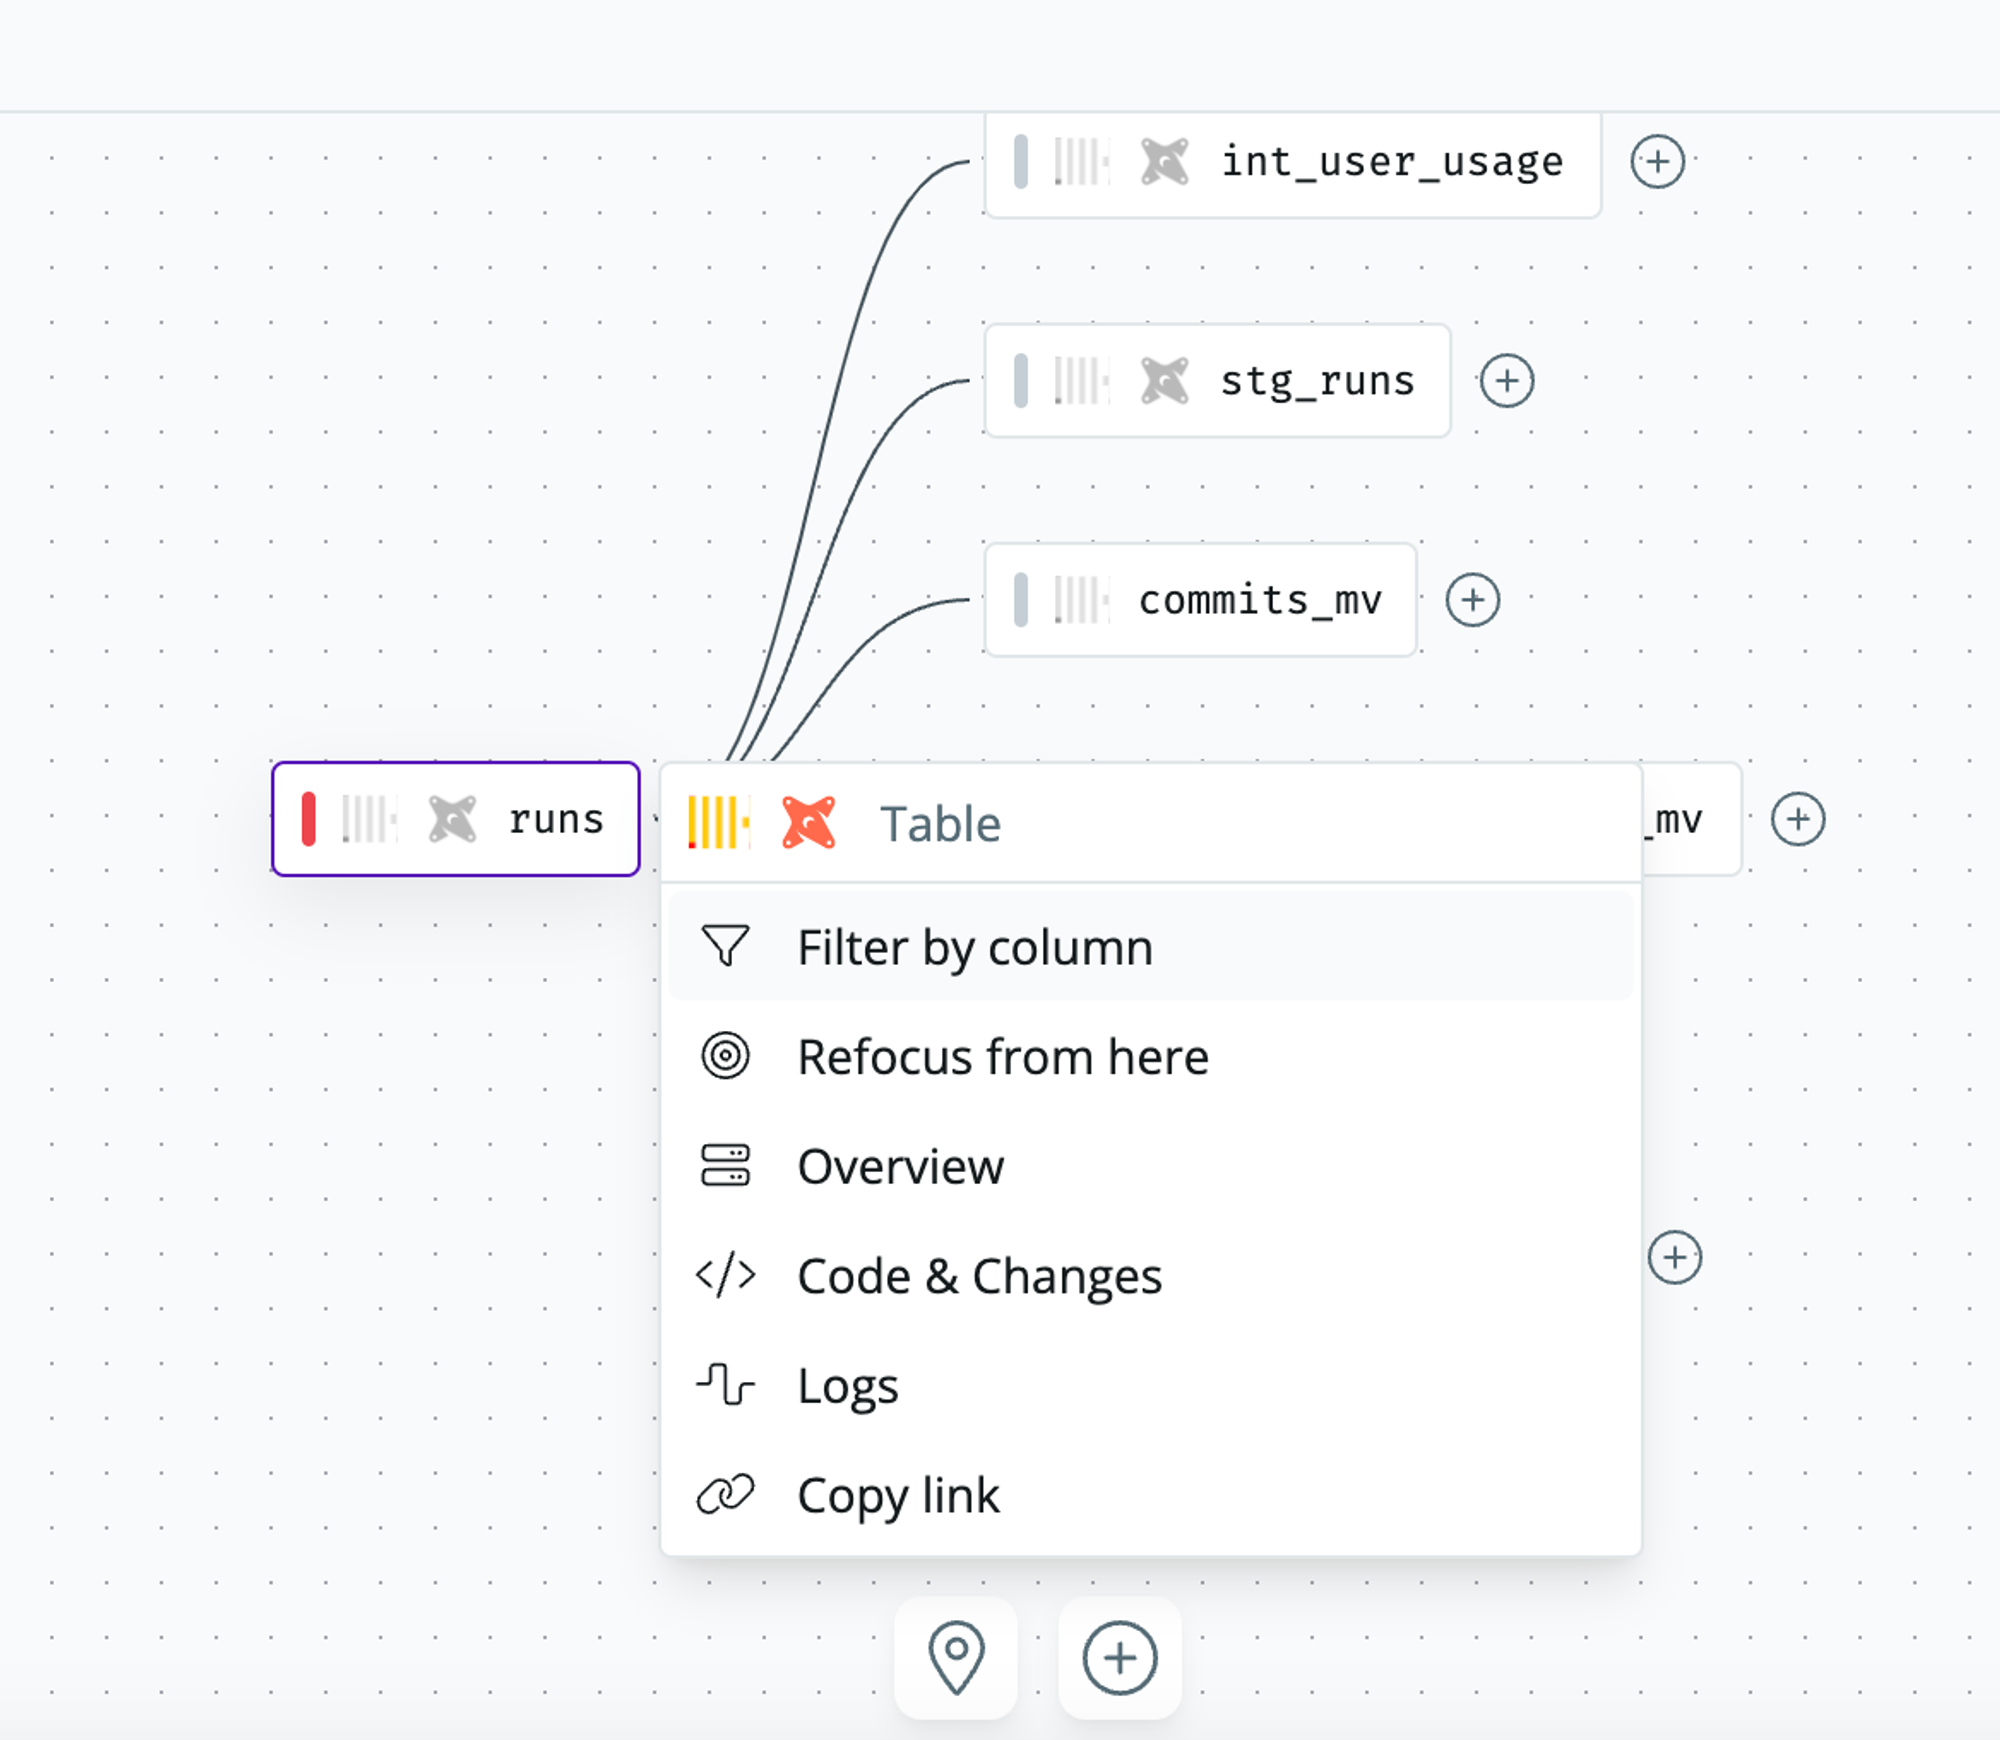 2. Filtering by a column lets you see all downstream assets where the column is being used. Click `X` to remove the column selection or `+` to expand the lineage.
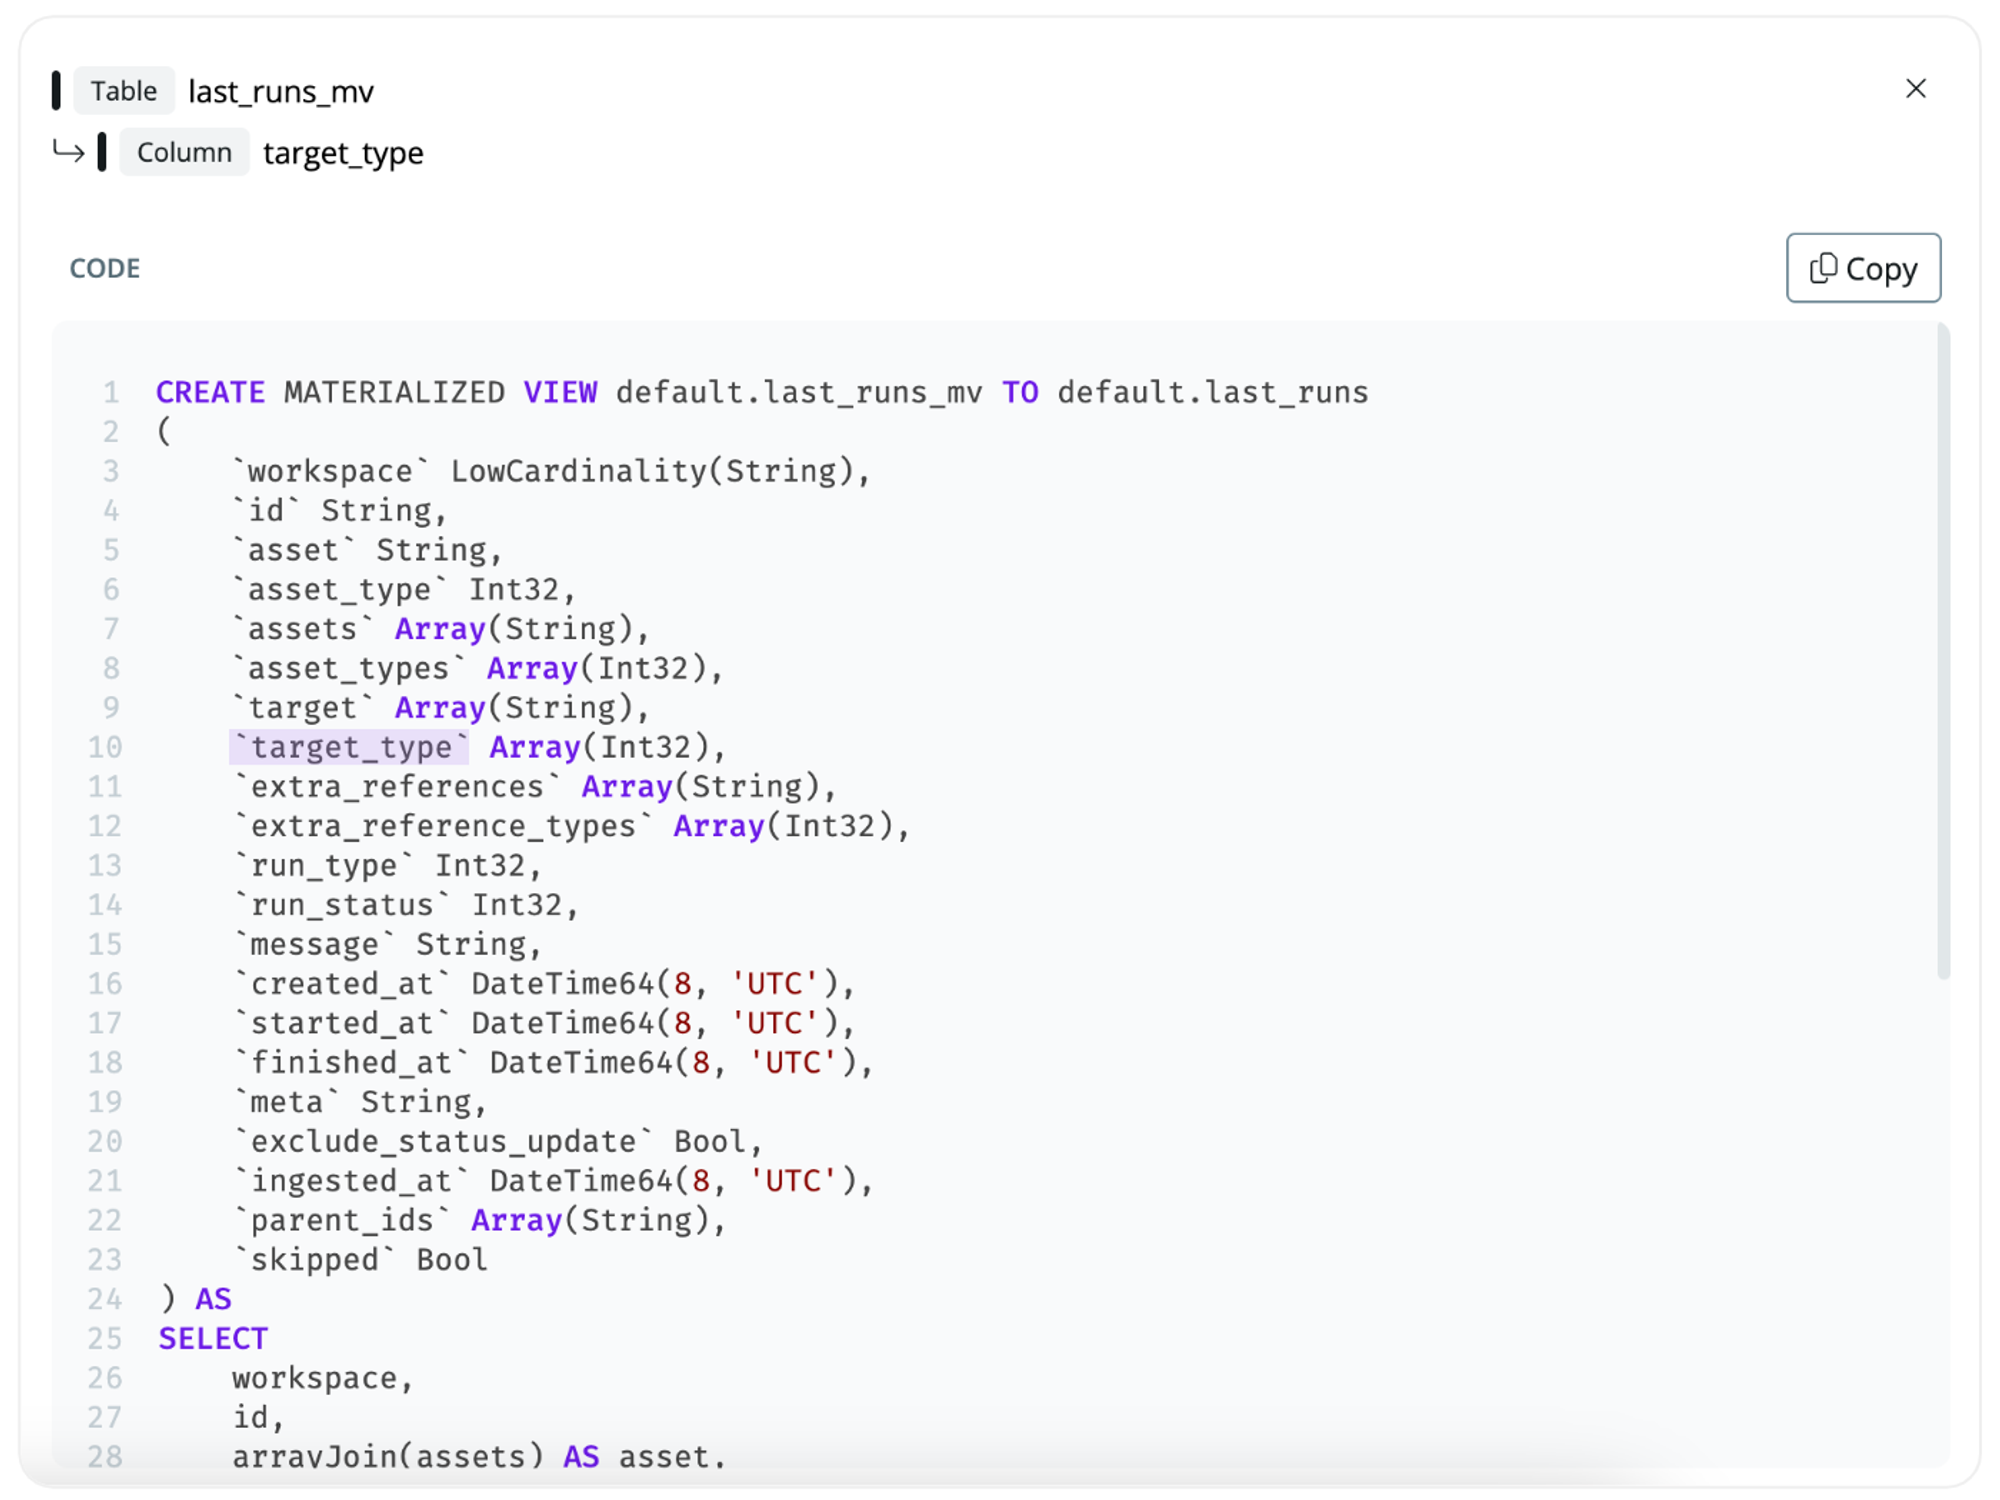
 3. Click on a column in one of the downstream assets to see how the column was derived in code
 ### Upstream lineage to trace down the issue's root cause
1. Navigate to the most downstream asset, such as a Looker dashboard you’re debugging.
### Upstream lineage to trace down the issue's root cause
1. Navigate to the most downstream asset, such as a Looker dashboard you’re debugging.
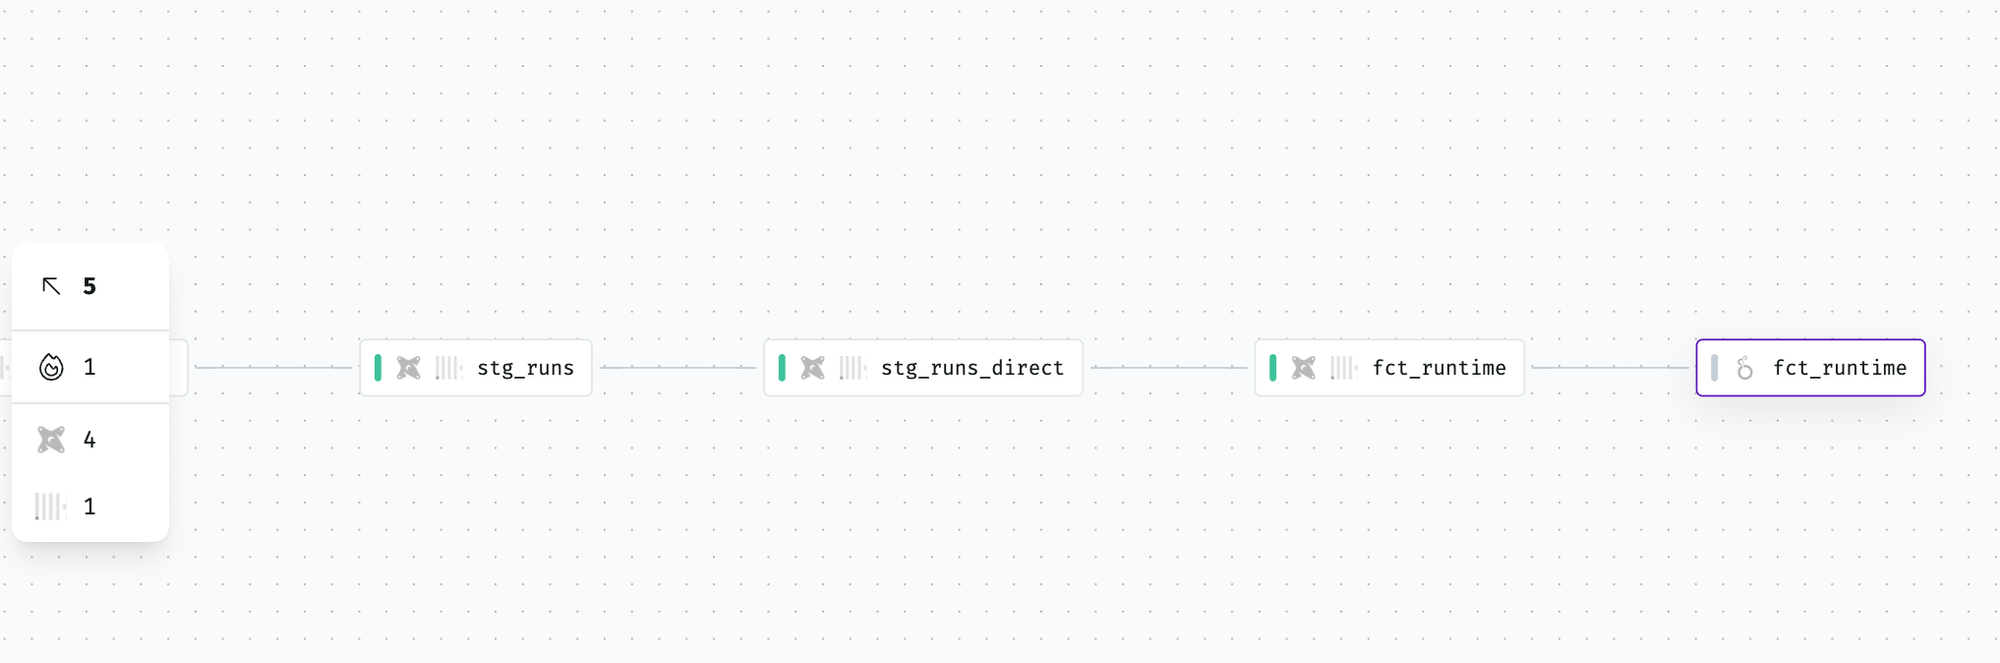 2. To trace upstream issues, use the left side menu bar to filter down on, e.g., sources or transformation models with status errors.
3. Click the data asset and select `Filter by column` to trace where a specific column is used upstream.
2. To trace upstream issues, use the left side menu bar to filter down on, e.g., sources or transformation models with status errors.
3. Click the data asset and select `Filter by column` to trace where a specific column is used upstream.