> ## Documentation Index
> Fetch the complete documentation index at: https://docs.synq.io/llms.txt
> Use this file to discover all available pages before exploring further.
# BI Status Badge
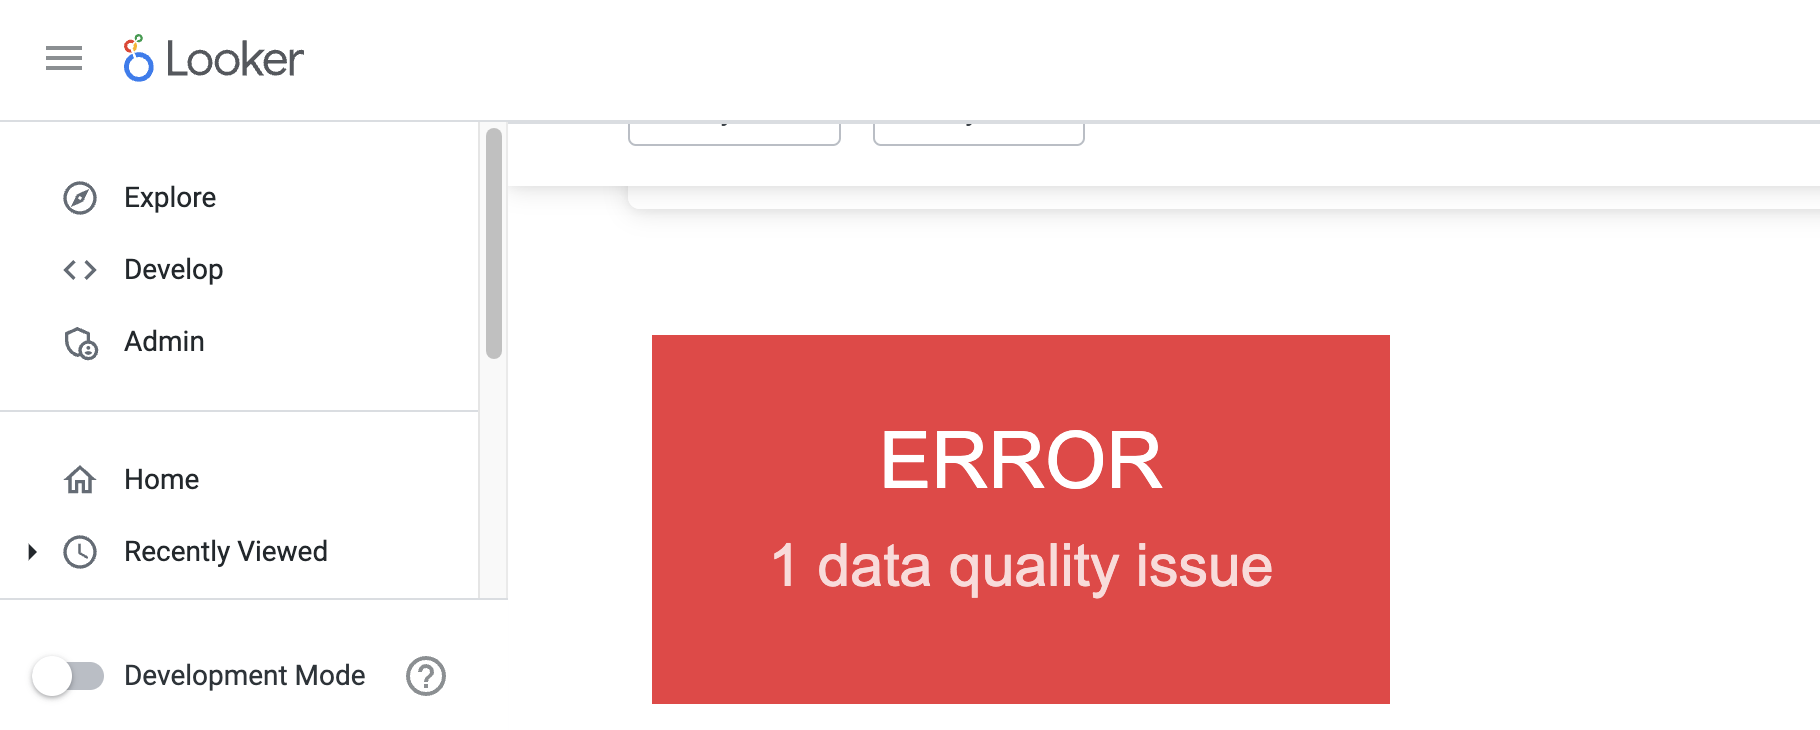
Often, the best way to notify end-users of issues is directly in the tools they use on a daily basis. With BI status badges, you can display if there are any issues on or upstream of a chart directly in your BI tool.
### Creating a BI badge
* Navigate to [Products](https://app.synq.io/products)
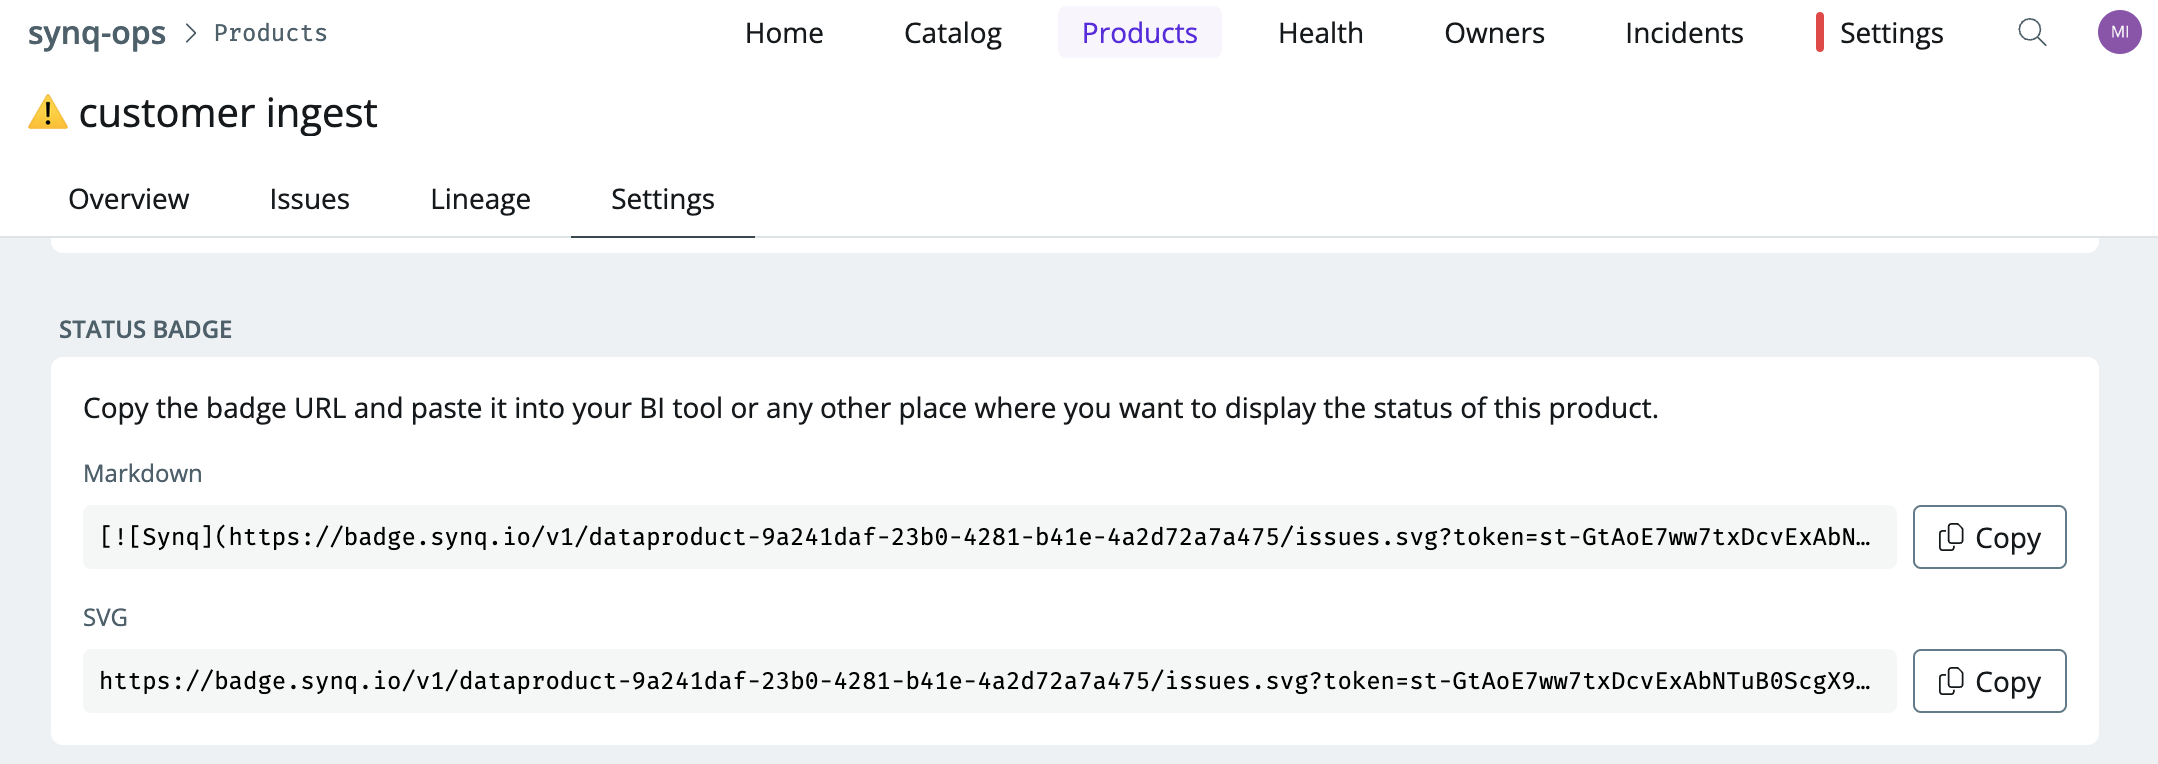
* Select the data product that contains the assets that you want to display the status of in your BI tool and navigate to the `settings` tab
* Depending on your BI tool, copy the relevant Markdown or SVG URL
* Navigate to your BI tool and insert a widget that points to the URL above. The level of support for this may vary depending on the BI tool you use
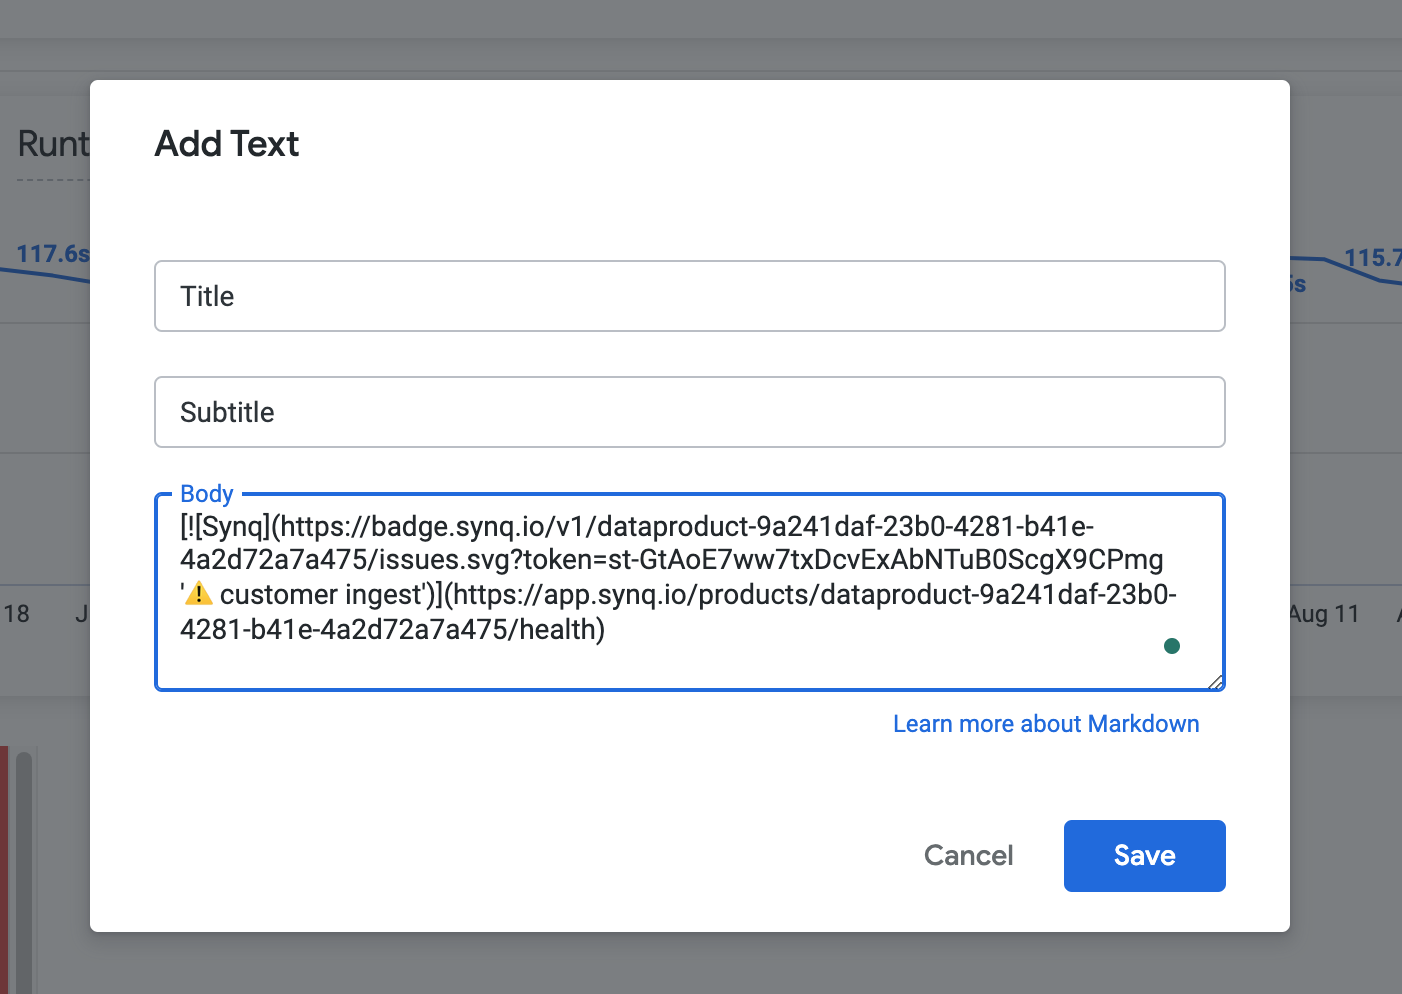
**Looker example**
If you use Looker, click `Add > Markdown` and paste the Markdown URL from Coalesce Quality into the `Body`
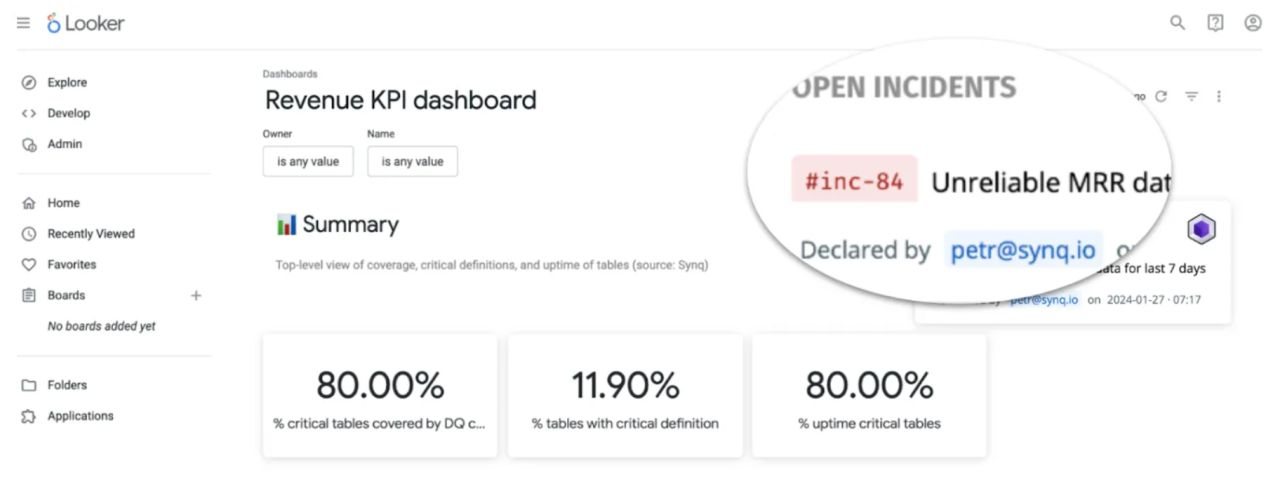
* Your BI tool will show a tile with the status of the data product. Clicking on the tile brings you back to Coalesce Quality with an overview of the issues to connect the dots.
 ### Creating a BI badge
* Navigate to [Products](https://app.synq.io/products)
* Select the data product that contains the assets that you want to display the status of in your BI tool and navigate to the `settings` tab
* Depending on your BI tool, copy the relevant Markdown or SVG URL
### Creating a BI badge
* Navigate to [Products](https://app.synq.io/products)
* Select the data product that contains the assets that you want to display the status of in your BI tool and navigate to the `settings` tab
* Depending on your BI tool, copy the relevant Markdown or SVG URL
 * Navigate to your BI tool and insert a widget that points to the URL above. The level of support for this may vary depending on the BI tool you use